
US$64.6b exports
Goods and services combined, in current US dollars. The comparable imports value was US$67.9b. Nominal values reflect exchange rates and prices as well as quantities.
Explore measured economic indicators and questions for assessing policy choices. Output, work, trade, prices and public finances are connected, but no single statistic tells the whole story or proves what caused a change.
Economy in a line: 2024 exports were US$64.6b and imports US$67.9b; unemployment was 5.6% in the June 2026 quarter. These measures describe different aspects of the economy and are not forecasts.
These indicators refer to different periods and answer different questions. Trade values are nominal current US dollars; unemployment is a seasonally adjusted share of the labour force.
Goods and services combined, in current US dollars. The comparable imports value was US$67.9b. Nominal values reflect exchange rates and prices as well as quantities.
Stats NZ’s seasonally adjusted rate for the June 2026 quarter. It measures unemployed people actively seeking and available for work as a share of the labour force—not all people without a job.
Sources: World Bank, exports of goods and services and imports of goods and services, 2024; Stats NZ, unemployment rate, June 2026 quarter, updated 5 August 2026.
Policy announcements and economic forecasts are not outcomes. A fair comparison uses the same time period, definitions and assumptions for every proposal, and separates published commitments from independent estimates.
Distinguish real from nominal GDP, identify the period covered, and examine assumptions about productivity, investment, migration and global demand.
Assess effects on prices, wages, taxes, transfers and essential costs across household types, while separating forecast inflation from the Reserve Bank’s independent decisions.
Use consistent labour-market and export measures, note changes in population and prices, and avoid attributing a change to one policy without supporting evaluation.
Compare operating and capital costs, funding sources, debt definitions, delivery milestones, ongoing maintenance and who receives benefits or bears costs.
Any government spending or revenue proposal can be assessed consistently by checking its published cost, funding source, timing, delivery assumptions and distributional effects. Forecasts are estimates, not guaranteed results.
Ongoing services, transfers and subsidies can create recurring costs. Check what allowance applies, when it is spent, and whether the stated amount covers all commitments.
Housing, transport and energy investments require capital approvals, operating support and future maintenance. Compare appropriations and delivery milestones—not only announced totals.
OBEGAL is not the same as cash balance or net debt. Check each forecast’s definition, price assumptions, interest costs, contingencies and sensitivity to slower growth.
Show which income groups, regions, industries and generations receive support or pay more, and include the effect of reduced services and user charges.
The supplied economy illustrations are prompts for investigation, not verified datasets. Follow each with an official series and its definition.
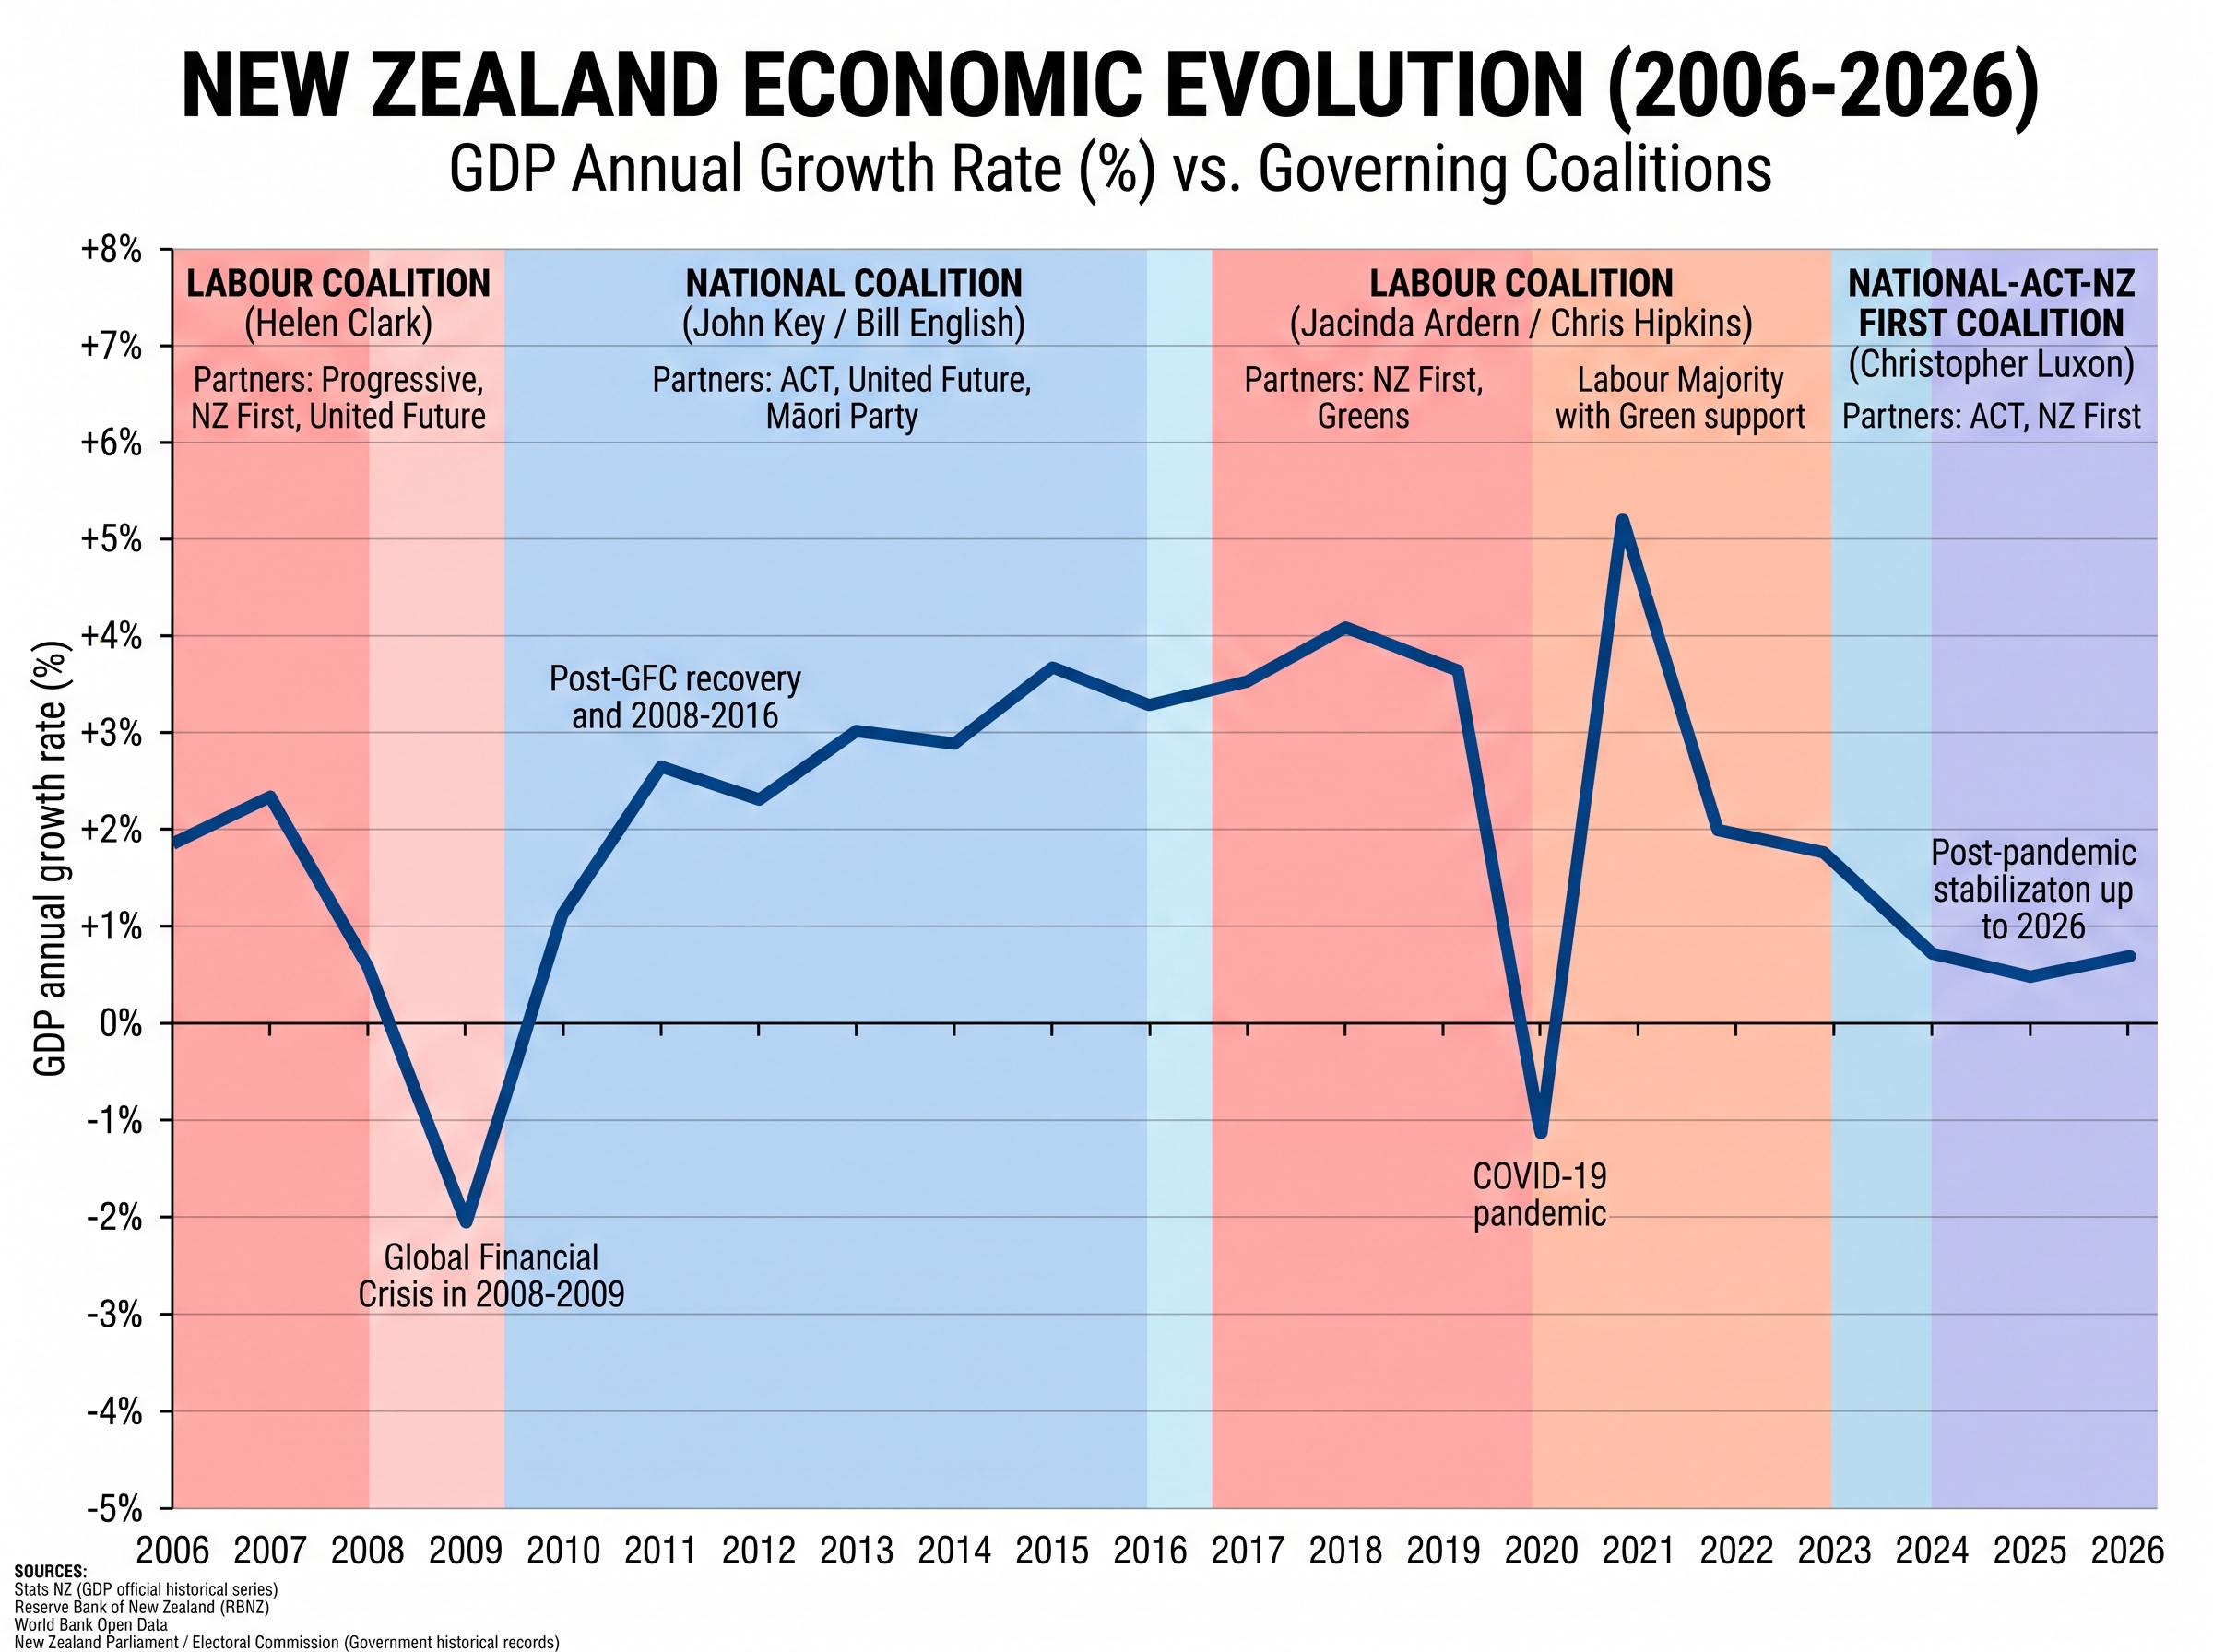
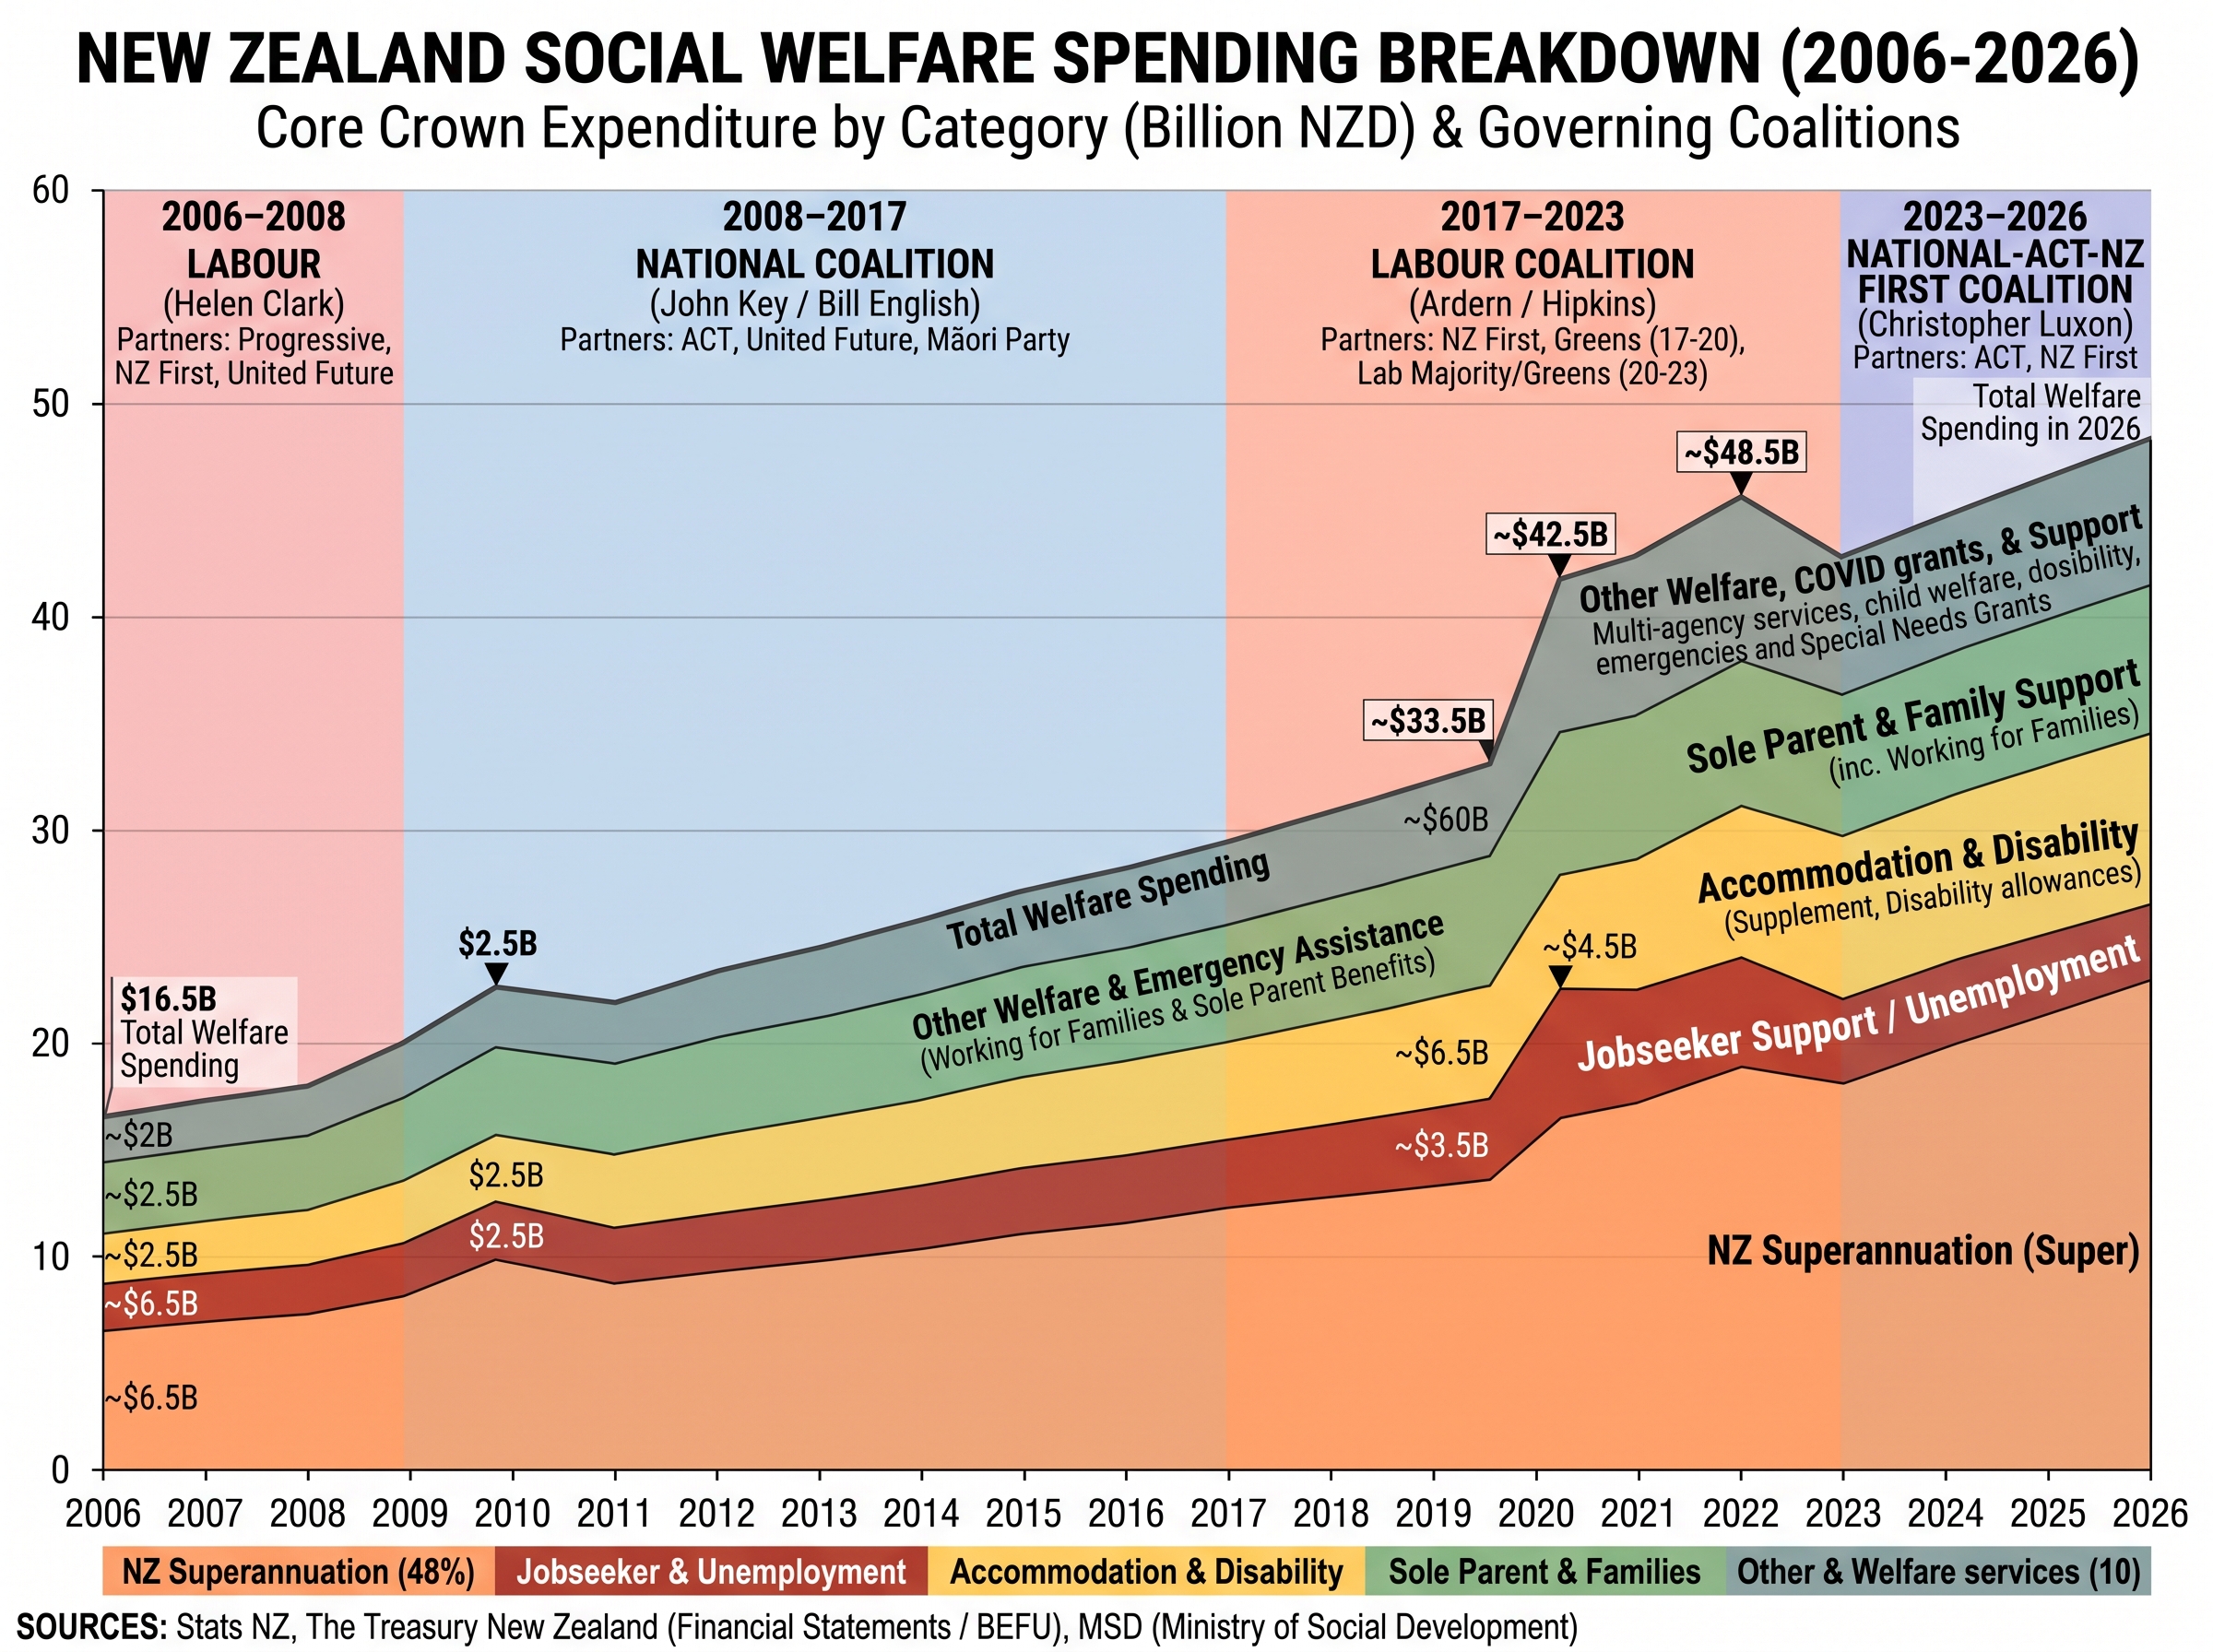
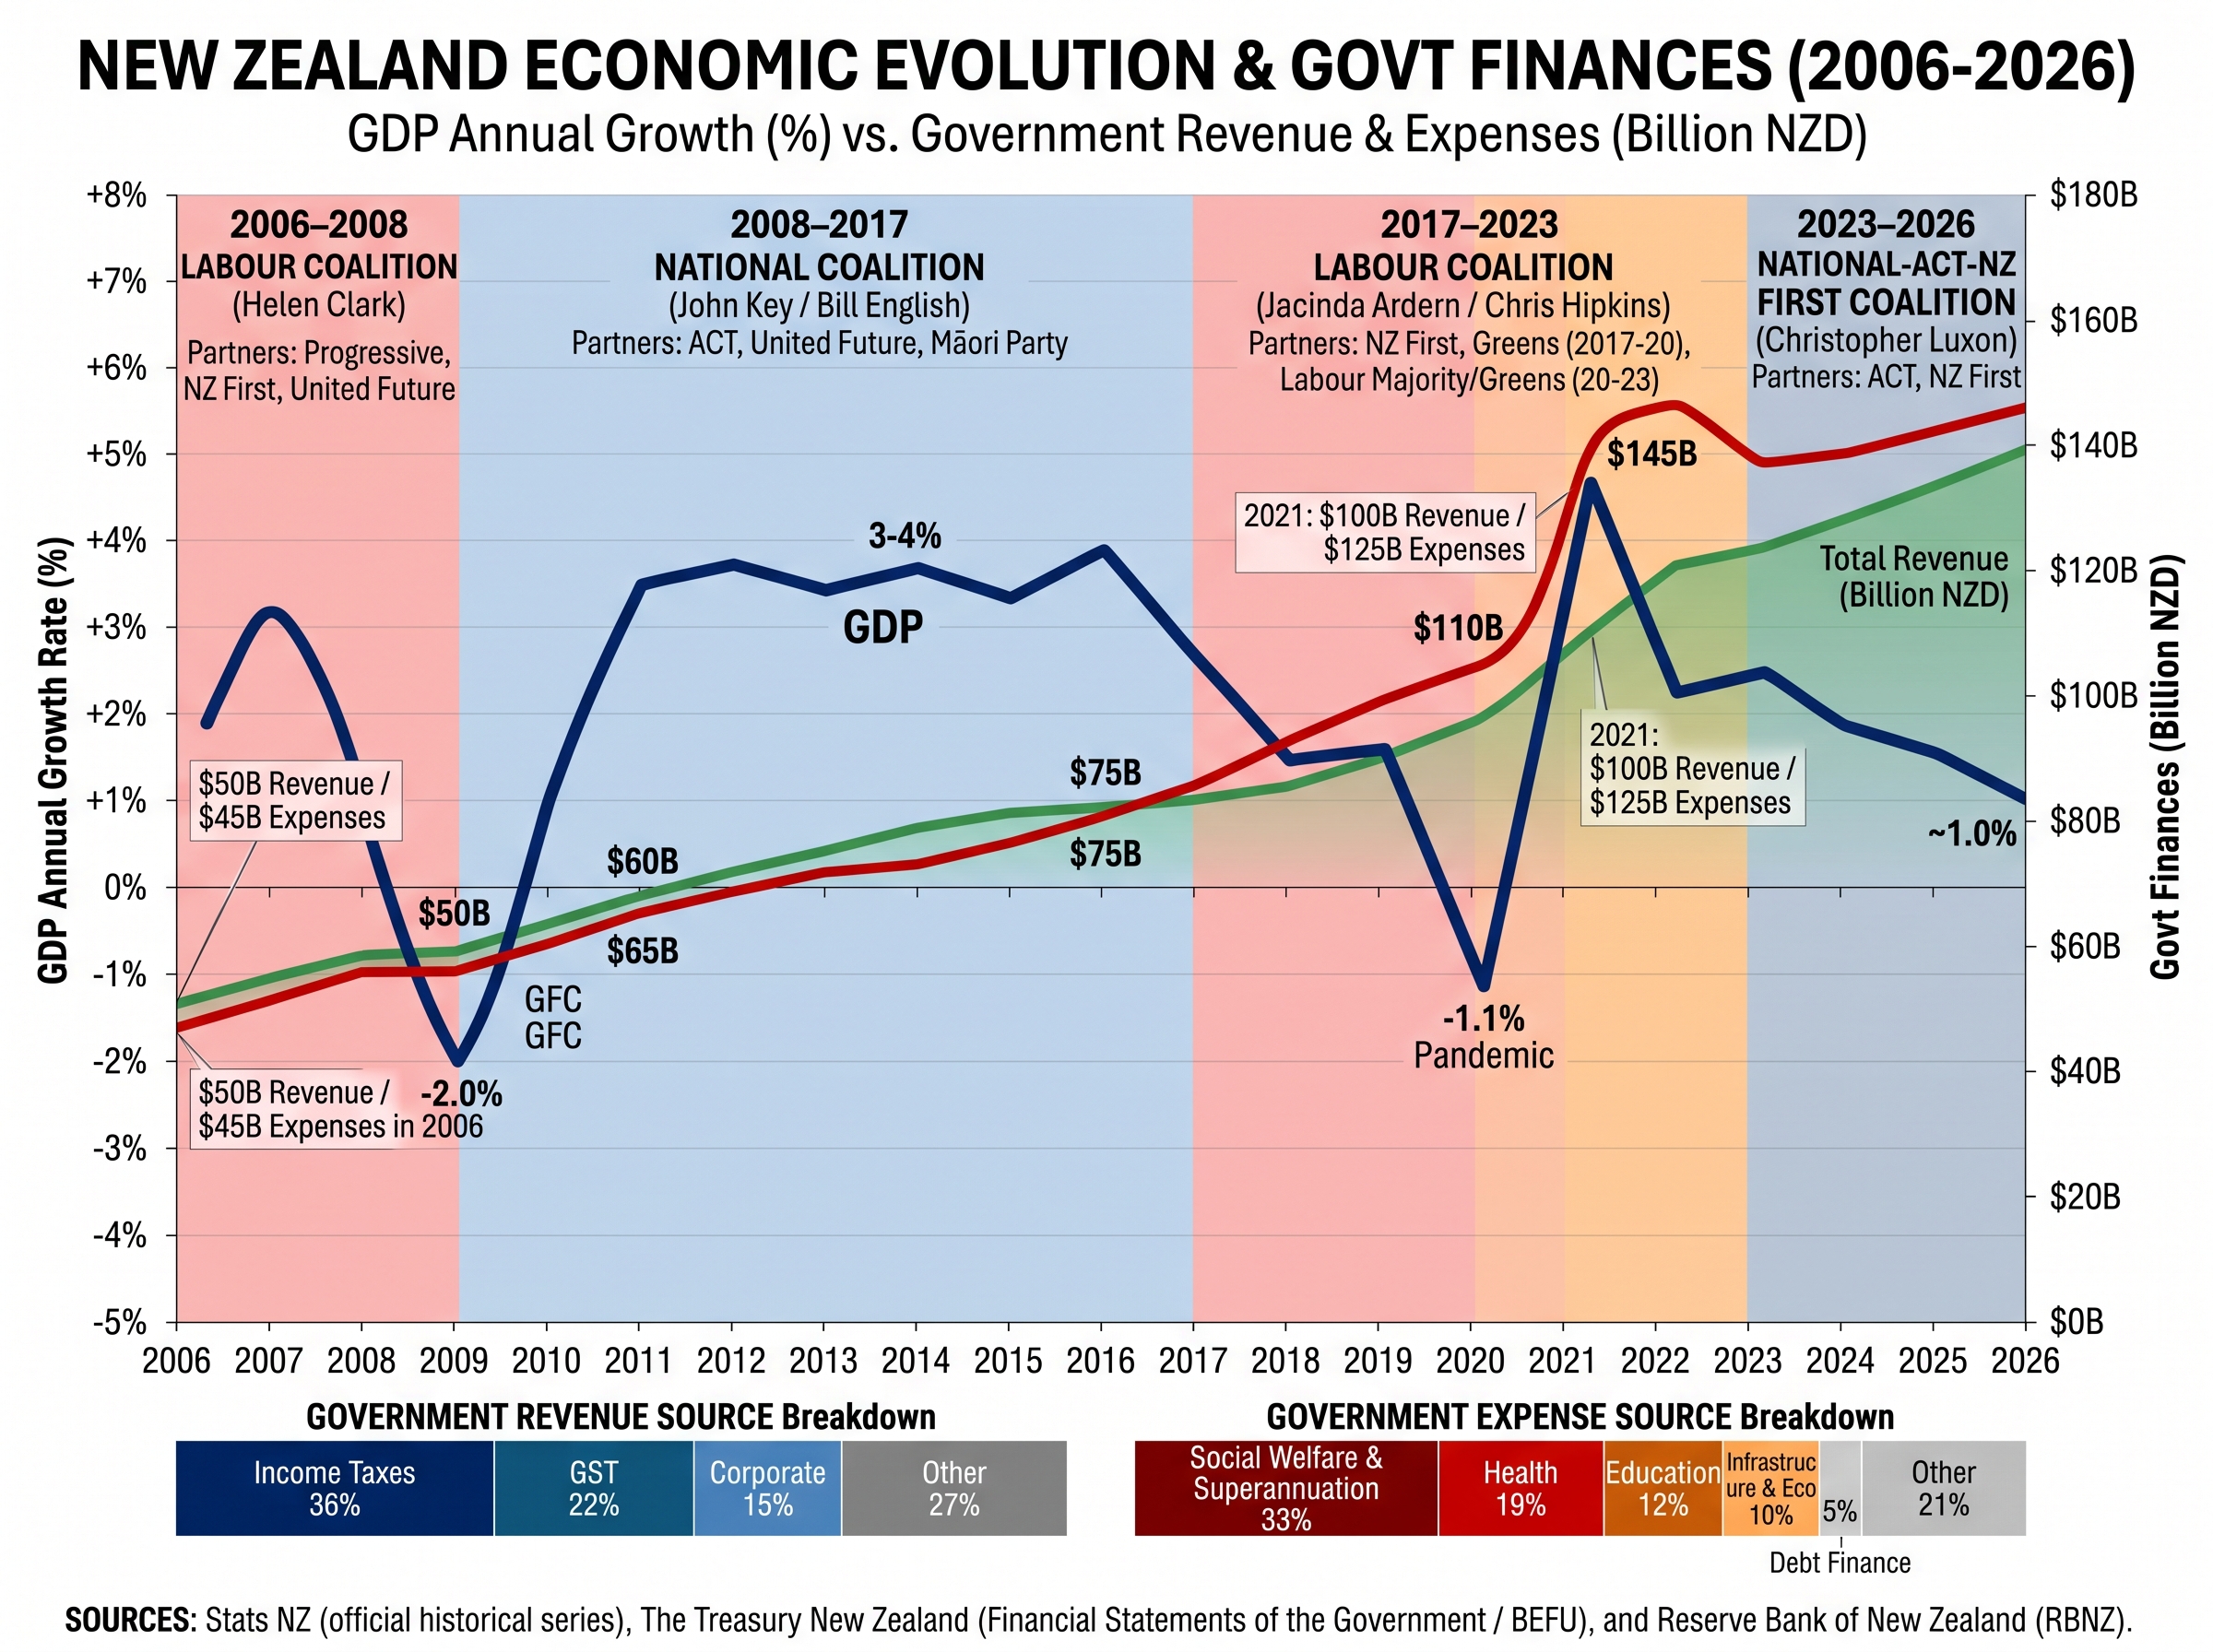
Verify economic growth and prices using Stats NZ economic statistics; fiscal forecasts using Treasury Economic and Fiscal Updates; and the policy rate using the Reserve Bank OCR series.