
Visitors, livelihoods
and a changing world.
Track international tourism receipts and overseas visitor arrivals across the available historical record, including the COVID-19 border interruption and the subsequent reopening. Tourism supports visitor-facing businesses and regional employment, but the indicators below measure different things.
A 20-year snapshot
This supplied illustration brings tourism trends together for context. Read it alongside the sourced arrivals and receipts series below.
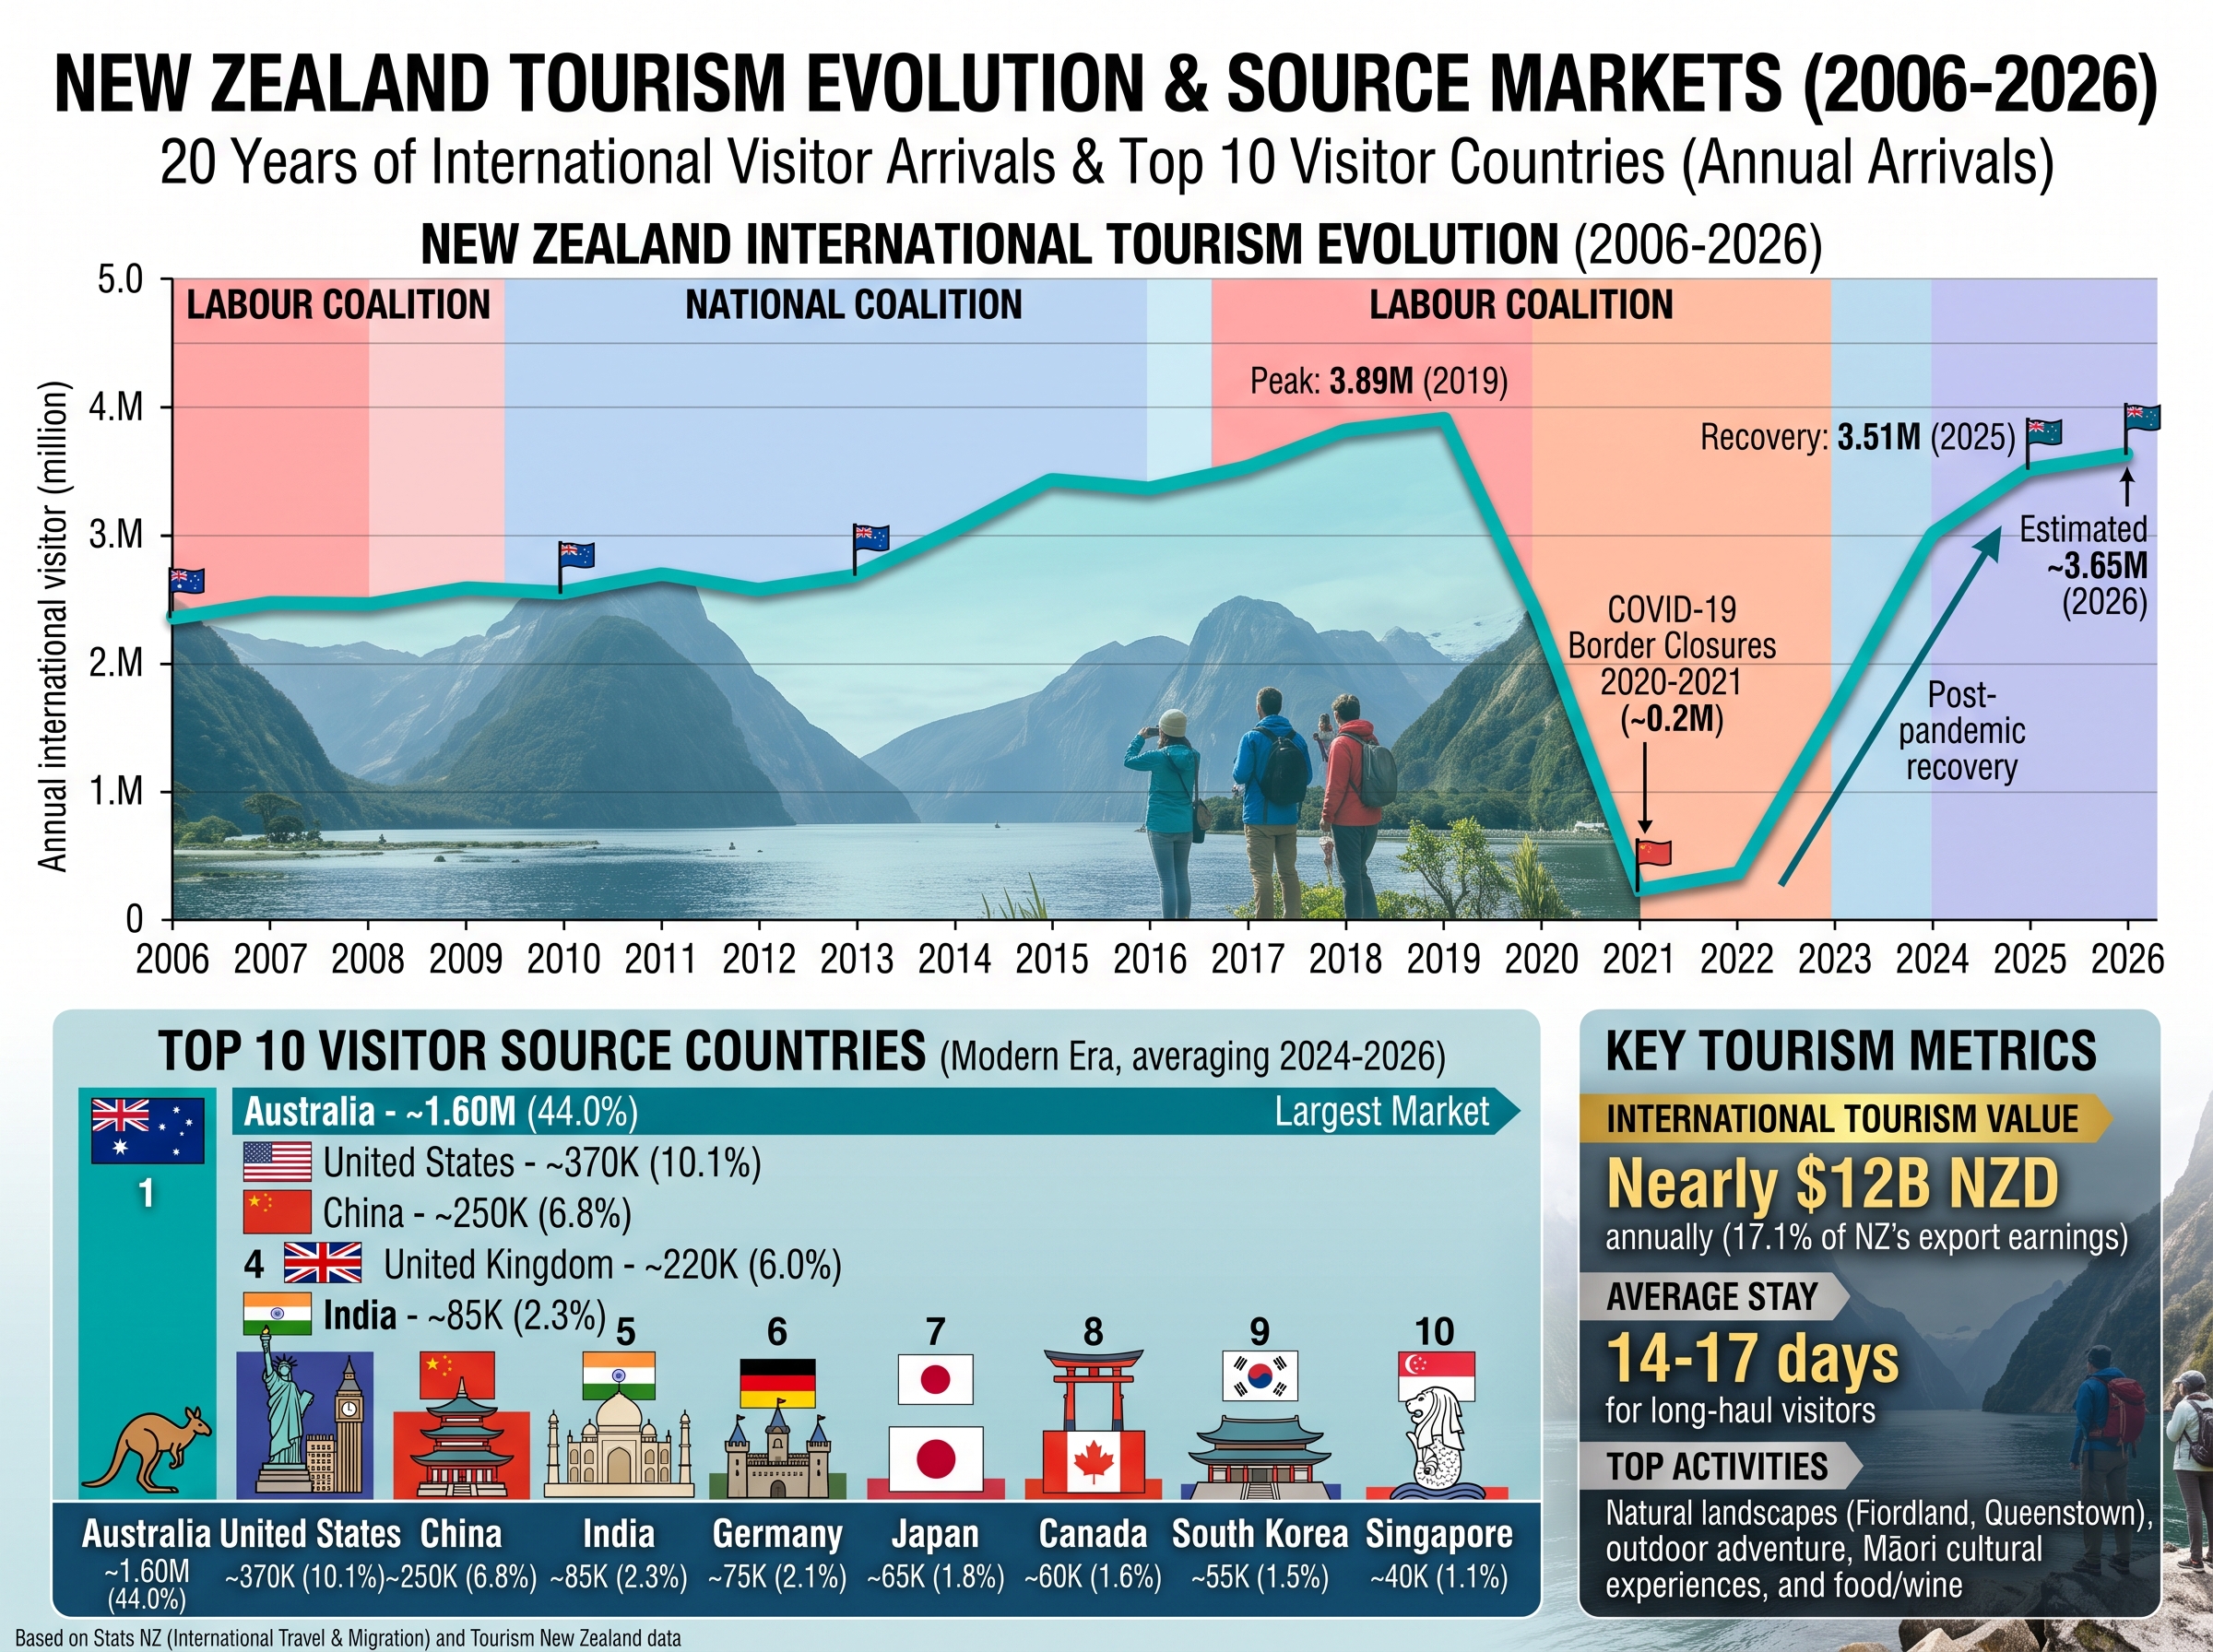
The figures, series definitions, annotations and source attributions in this image have not been independently verified. Use the sourced Stats NZ and World Bank charts below for specific values.
International tourism receipts
The World Bank’s annual international tourism receipts series provides a longer historical view, but the latest values available here end in 2018. Values are current US dollars, not inflation-adjusted, and can also move with exchange rates.
Receipts rose through 2018 in nominal terms
View annual values
| Year | Receipts (US$ billions) |
|---|---|
| 2006 | 6.15 |
| 2007 | 7.19 |
| 2008 | 6.96 |
| 2009 | 5.98 |
| 2010 | 6.52 |
| 2011 | 7.30 |
| 2012 | 7.14 |
| 2013 | 7.43 |
| 2014 | 8.58 |
| 2015 | 9.46 |
| 2016 | 9.77 |
| 2017 | 10.59 |
| 2018 | 10.96 |
Source: World Bank indicator ST.INT.RCPT.CD. The World Bank series is international tourism receipts, not total domestic tourism spending or the contribution of tourism to GDP.
Overseas visitor arrivals and the border shock
This annual arrivals trend spans 2006–2025: World Bank international tourism arrivals are used through 2016, followed by Stats NZ monthly overseas visitor arrivals summed into full calendar years from 2017. The Stats NZ series currently runs through July 2026, so that partial year is not plotted. A source marker identifies the change; the overlapping 2017–2020 values are close, but the series should not be treated as perfectly identical.
International arrivals climbed before the border shock
View annual arrival totals
| Year | Arrivals | Source |
|---|---|---|
| 2006 | 2,409,000 | World Bank |
| 2007 | 2,455,000 | World Bank |
| 2008 | 2,483,000 | World Bank |
| 2009 | 2,473,000 | World Bank |
| 2010 | 2,530,000 | World Bank |
| 2011 | 2,617,000 | World Bank |
| 2012 | 2,574,000 | World Bank |
| 2013 | 2,710,000 | World Bank |
| 2014 | 2,854,000 | World Bank |
| 2015 | 3,129,000 | World Bank |
| 2016 | 3,494,000 | World Bank |
| 2017 | 3,733,707 | Stats NZ |
| 2018 | 3,863,217 | Stats NZ |
| 2019 | 3,888,473 | Stats NZ |
| 2020 | 996,350 | Stats NZ |
| 2021 | 206,862 | Stats NZ |
| 2022 | 1,433,832 | Stats NZ |
| 2023 | 2,955,074 | Stats NZ |
| 2024 | 3,313,802 | Stats NZ |
| 2025 | 3,509,432 | Stats NZ |
Sources: World Bank international tourism arrivals (2006–2016), rounded to the nearest thousand; and the Stats NZ tourism topic page, monthly overseas visitor arrivals (2017–2025 summed by calendar year). The 2017–2020 overlap is close between sources but definitions and revisions may differ. The Stats NZ source series extends through July 2026; all arrival totals shown here are complete calendar years.
A regional action plan to grow tourism responsibly
A concept for connecting distinctive regional experiences with the access, services and visitor hubs needed to support them. It is a discussion framework, not a list of approved or funded projects.
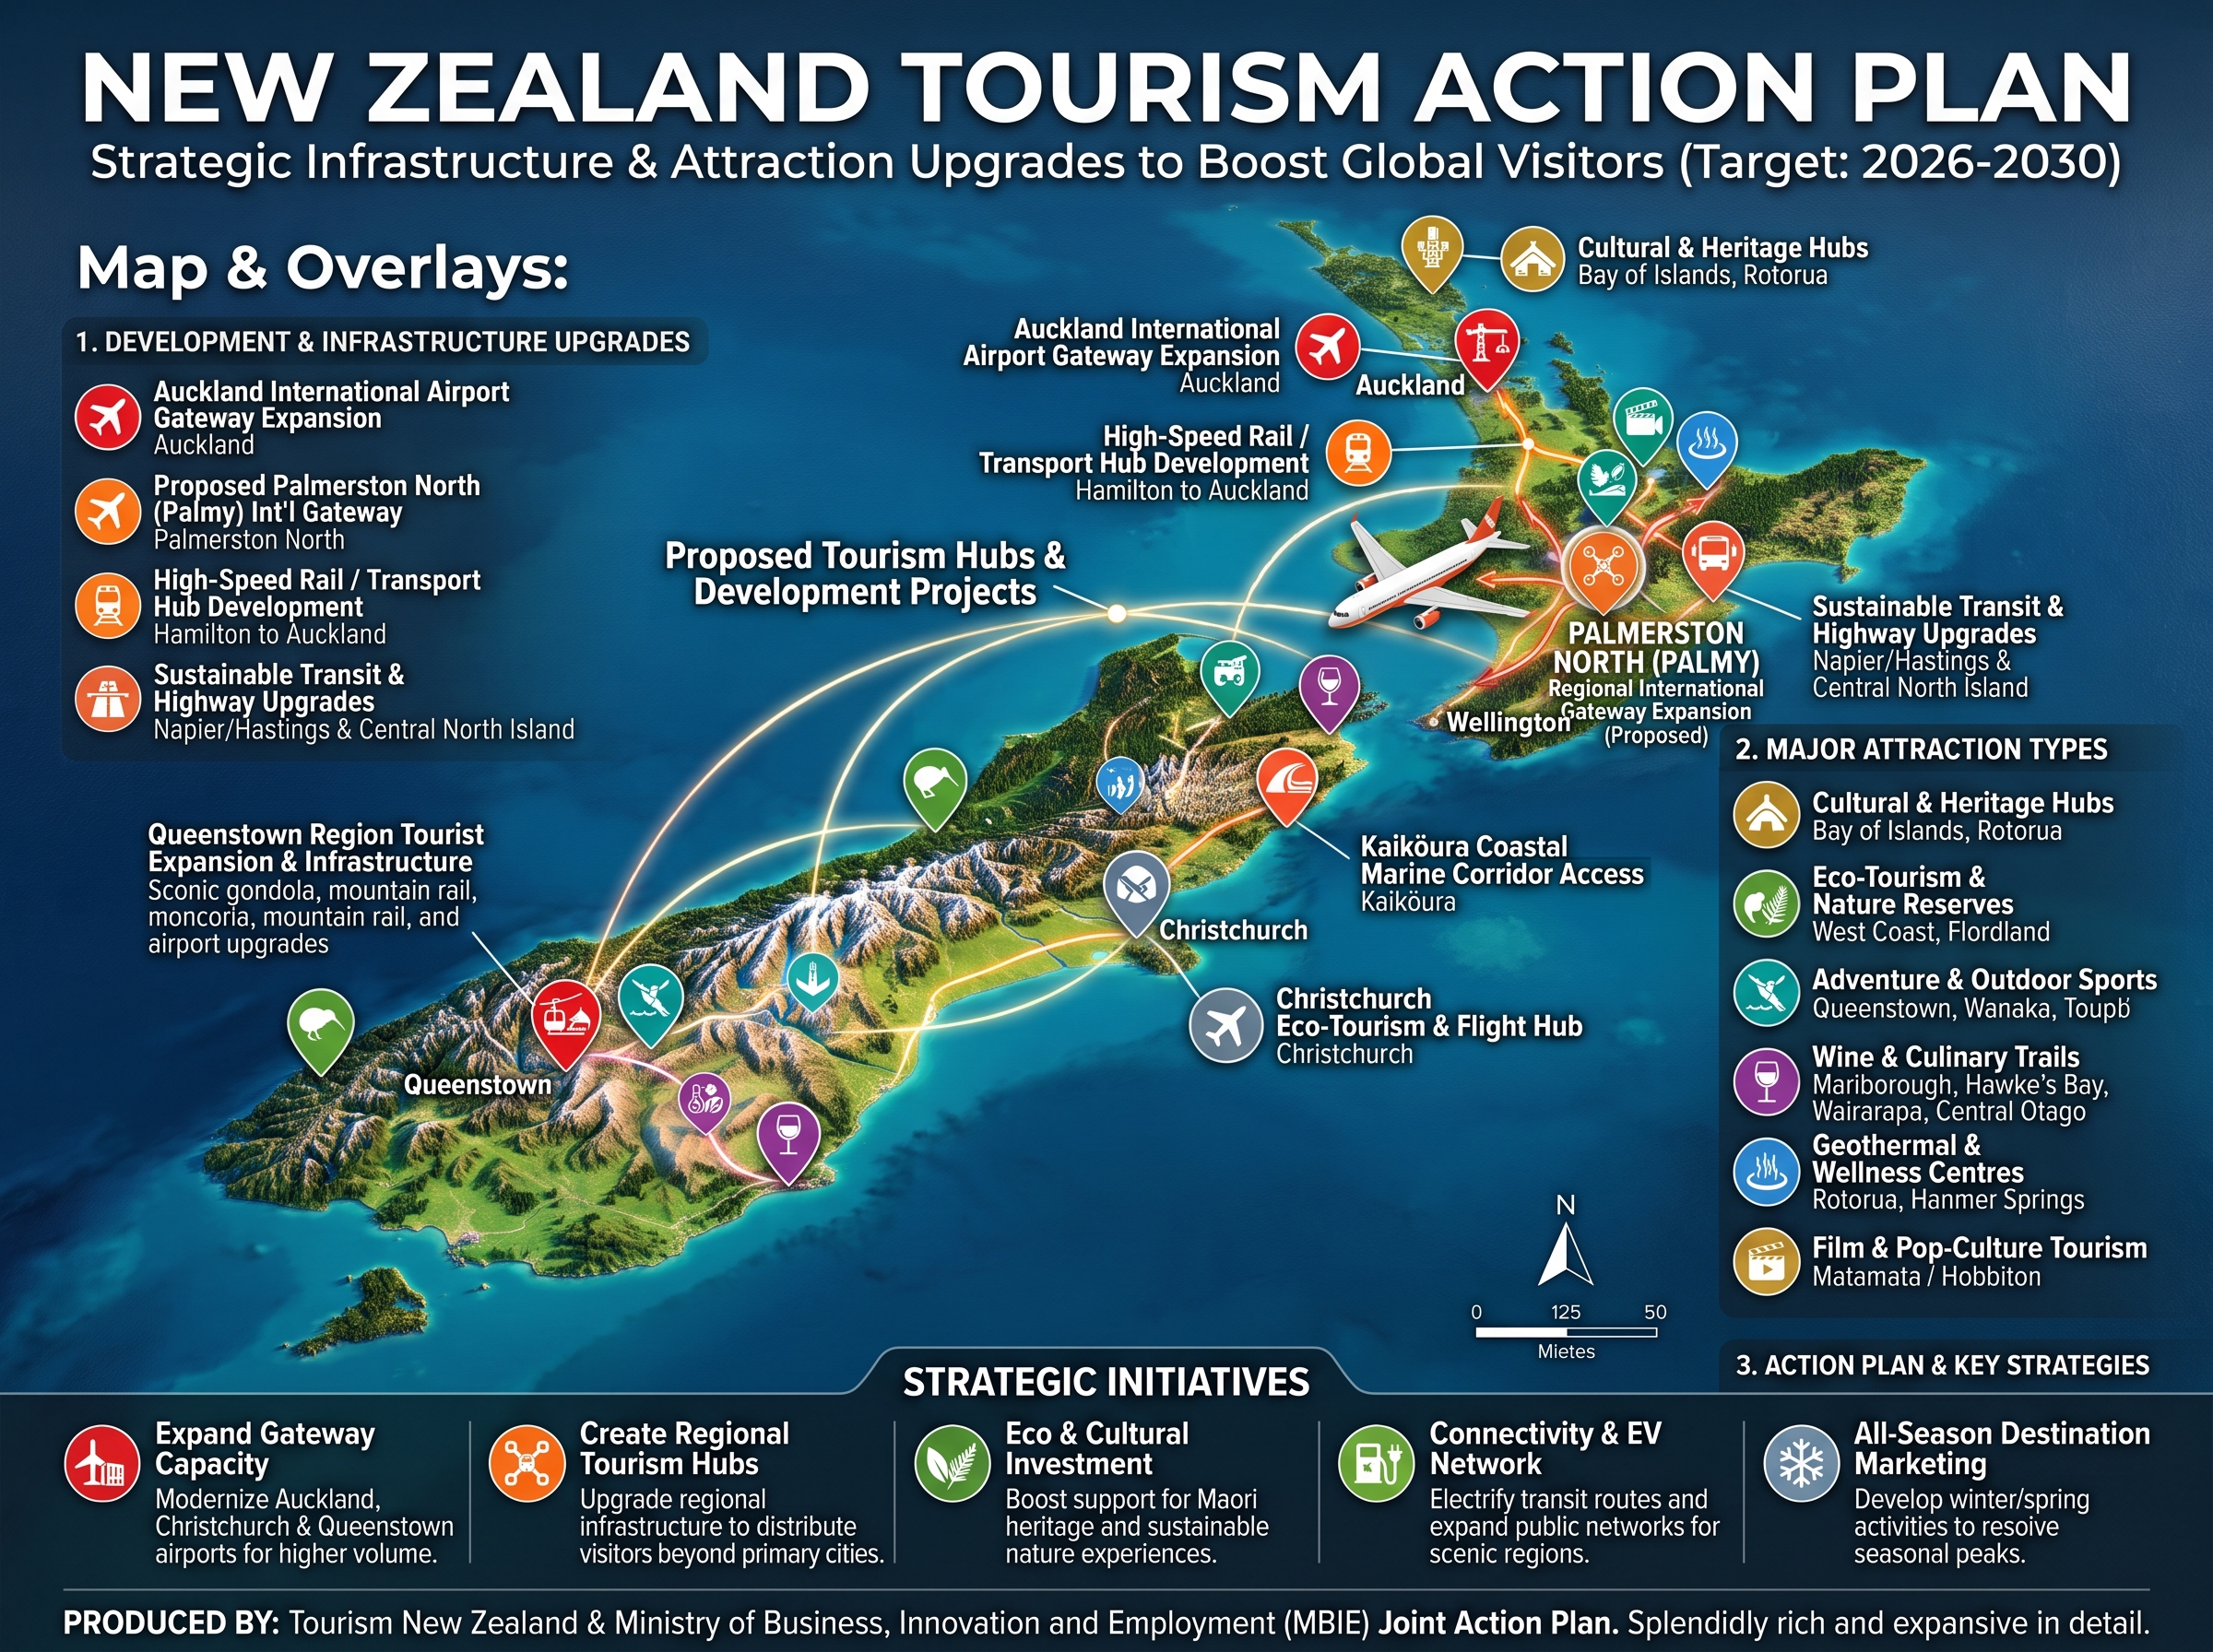
This supplied proposal image is illustrative; its figures, annotations, development locations and source attributions have not been independently verified. Treat it as a concept, not an approved or funded investment plan.
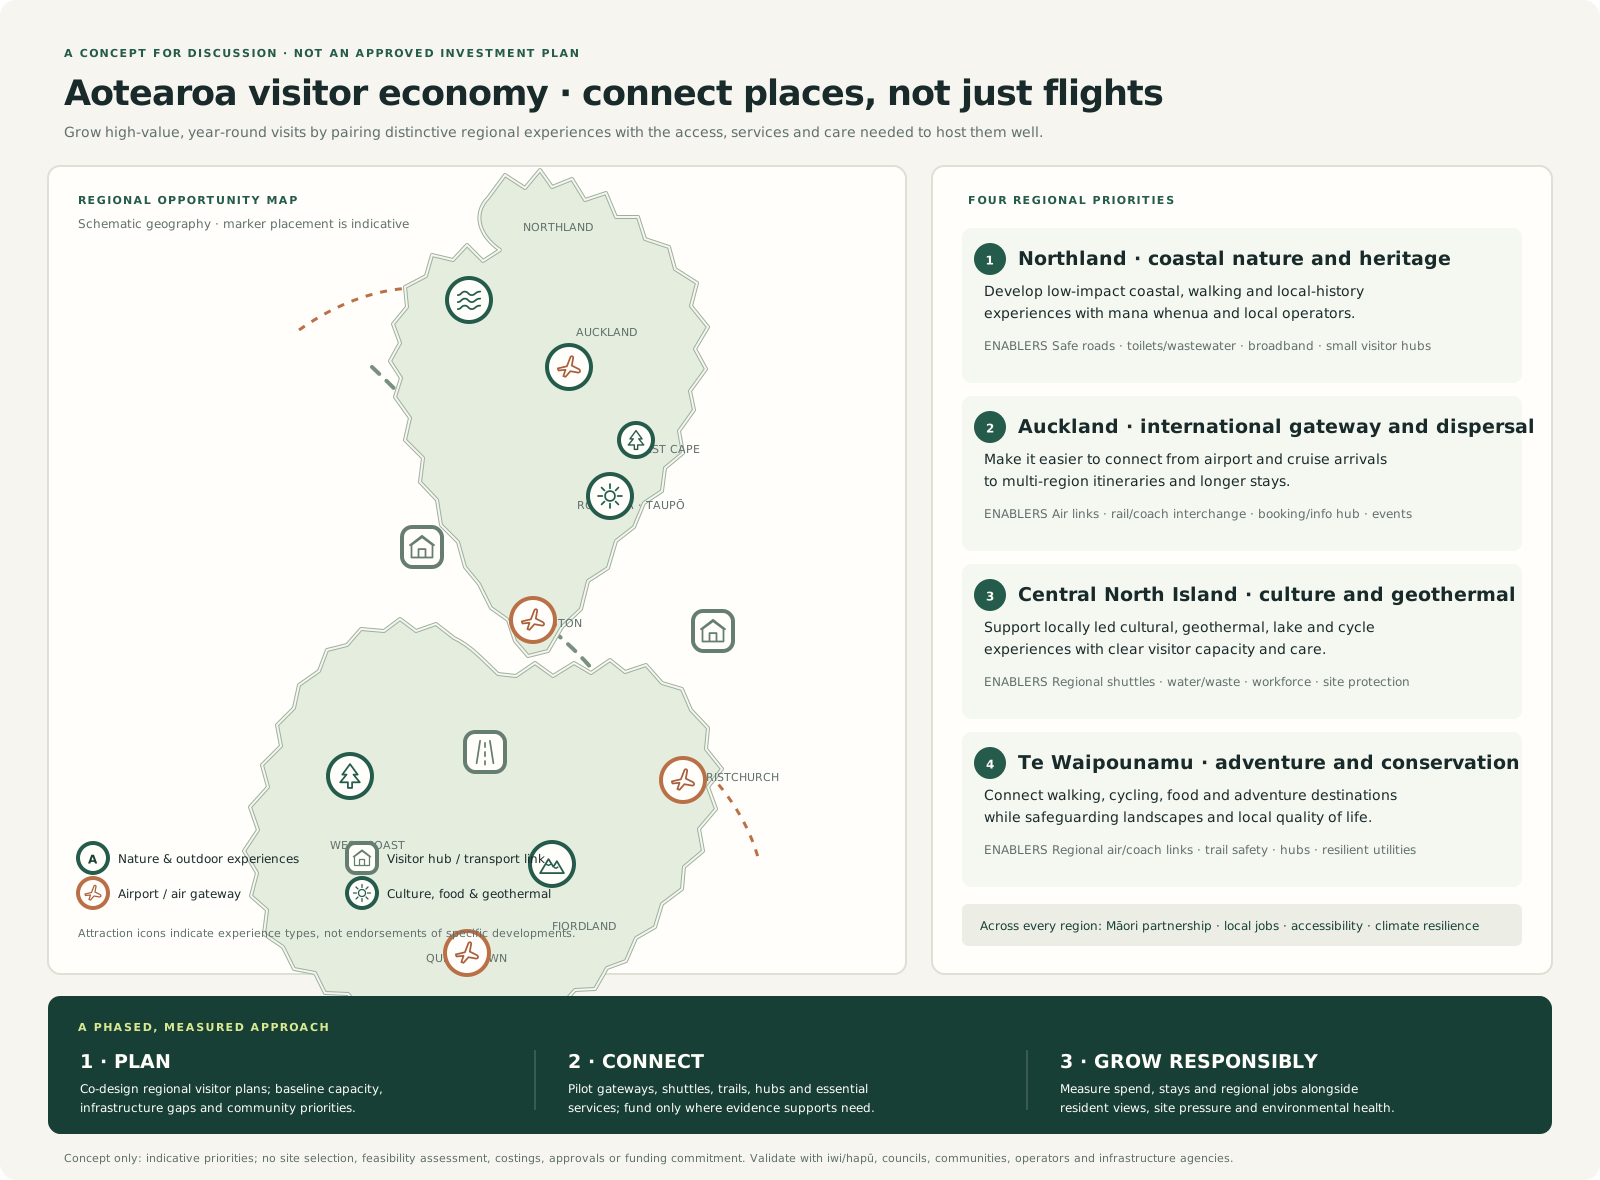
Priorities and marker locations are illustrative, not a feasibility assessment. Any investment should be co-designed with iwi and hapū, local communities, councils, tourism operators and infrastructure agencies; assess demand, capacity, costs and environmental effects before selecting projects.
A changing tourism context
These milestones help interpret the series; they do not estimate the separate effect of any government policy, event or market change.
- 2006–19Visitor growth
International travel and receipts expand
World Bank international tourism receipts rose in nominal US-dollar terms through 2018. The available Stats NZ visitor-arrivals series begins later, in July 2016, and shows full-year arrivals near 3.9 million in 2019. These measures have different definitions and currencies.
- 2020–21Border restrictionsCOVID-19
International visitor arrivals collapse
New Zealand’s international border restrictions during the pandemic sharply reduced overseas visitor arrivals. Arrivals fell to about 207,000 in 2021, from 3.89 million in 2019. This is a measure of border crossings, not a direct estimate of lost tourism spending or jobs.
- 2022–25ReopeningRecovery
Visitors return as borders reopen
Arrivals increased after borders reopened, reaching 3.51 million in 2025—still below the 2019 total in this series. Recovery differs by source market, season, region and business type. MBIE’s International Visitor Survey expenditure estimates are survey-based and subject to uncertainty and methodological revisions.
- 2026Partial year
Keep year-to-date figures separate
The Stats NZ series currently includes monthly observations only through July 2026. Do not compare that partial-year total directly with a full calendar year. Use the latest MBIE survey release for visitor spending and disclose its reporting period and revisions.
For border and reopening information, see MBIE tourism and its International Visitor Survey. MBIE notes that quarterly survey estimates have margins of error and that historical estimates can be recalibrated.
Evidence to follow
A fuller 20-year assessment should add domestic tourism, visitor spend by source market and region, tourism’s contribution to GDP and employment, seasonality, business closures, and environmental and community impacts.