
Who owns the home they live in?
Track owner-occupied tenure at comparable census points from 2006 onward. Break out age, household type, region and ethnicity where definitions and data support it; also track first-home access and deposit barriers.
Compare changes in home ownership, house prices, rental-property returns and rents over the last 20 years. Keep the experience of people buying a home, tenants paying rent and investors owning rental property distinct, while tracing how they interact.
The supplied chart brings ownership, house prices, rents and gross rental yields together. Use it as an illustration of the questions this page examines, not as verified data.
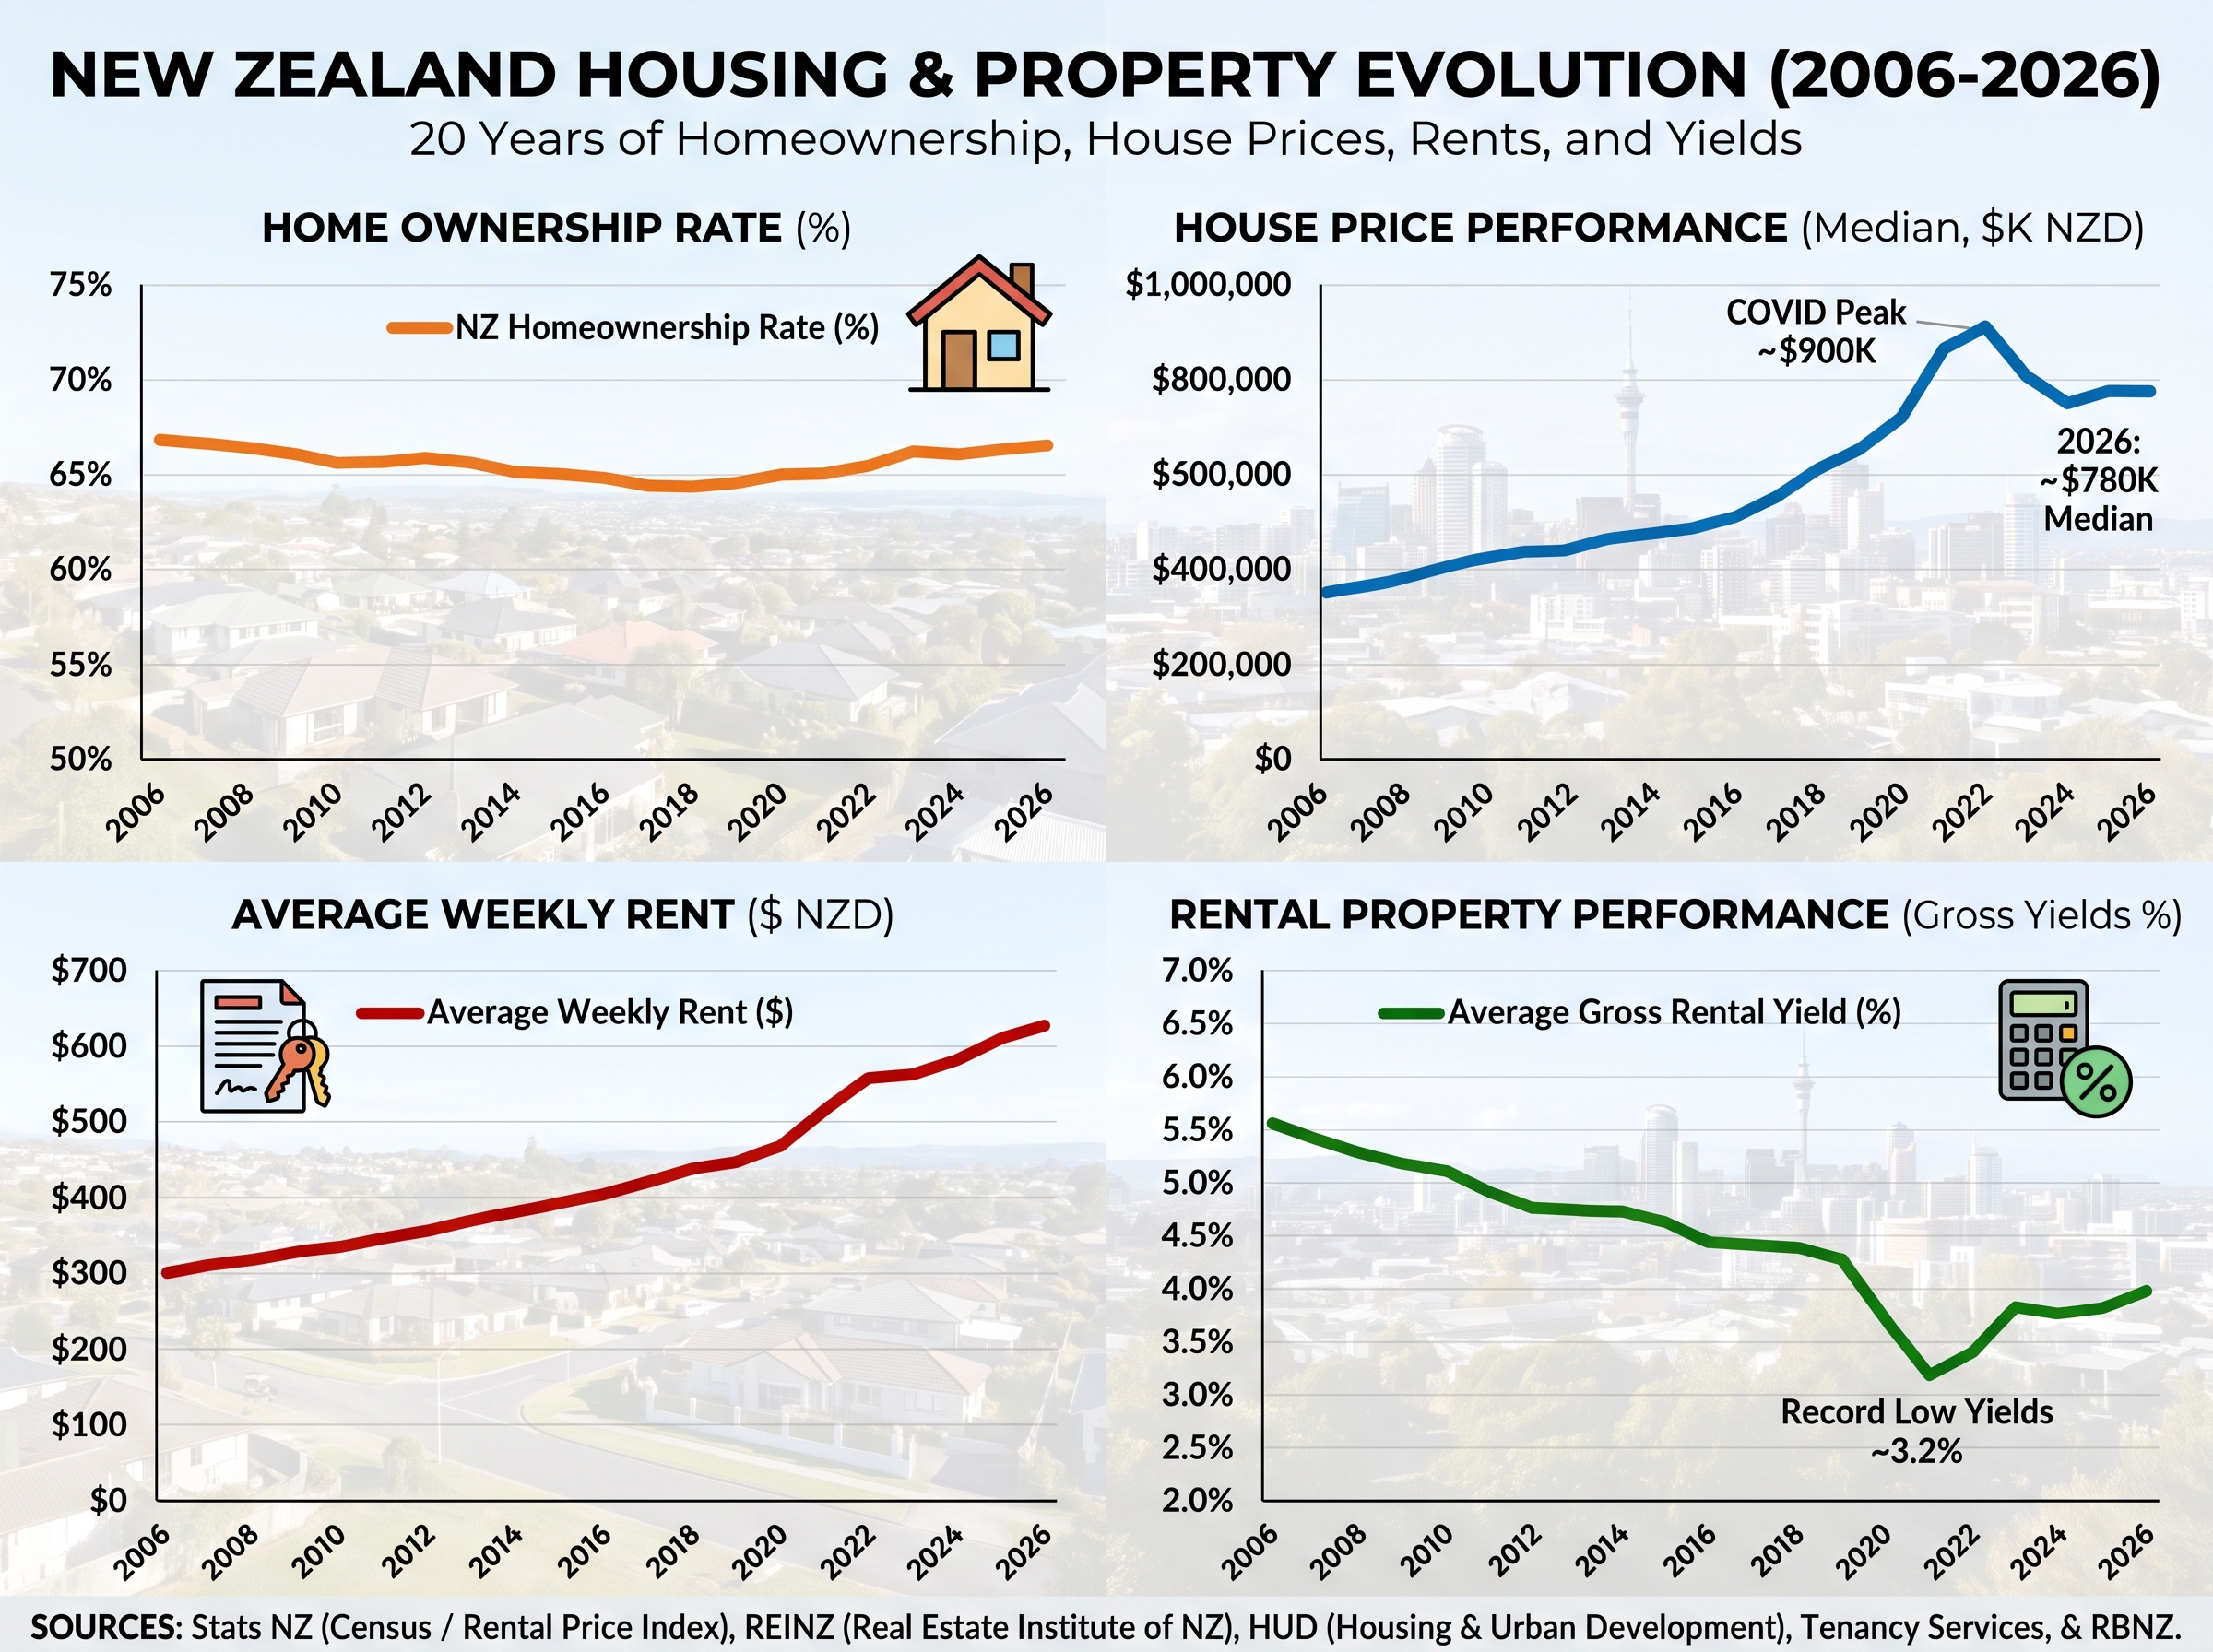
The image includes source attributions to Stats NZ, REINZ, HUD, Tenancy Services and the Reserve Bank. The underlying series, definitions, dates, calculations and projections have not yet been independently checked. In particular, gross rental yield is not a net or total investment return.
A price increase is not the same as an investment return, and a rise in rents is not the same as a change in affordability. Track each outcome in a consistent series and compare it with incomes, inflation and costs.
Track owner-occupied tenure at comparable census points from 2006 onward. Break out age, household type, region and ethnicity where definitions and data support it; also track first-home access and deposit barriers.
Use a quality-adjusted house-price index for the long-run trend, alongside nominal sale prices. Show inflation-adjusted movement, annualised change and price-to-income comparisons; note geographic and property-type differences.
Separate capital gains from rental income. Estimate gross yield and net total return after vacancy, rates, insurance, maintenance, management, financing and tax; state the assumed purchase date, leverage, tax rules and sale costs.
Compare rents for new tenancies with rents paid across the existing rental stock, using official rent-price measures. Show real rent changes and rent relative to household income, not just weekly dollars.
The analysis should make the 20-year housing story understandable without presenting a house-price chart as the whole story.
Follow planning and infrastructure changes, construction costs, building activity and housing completions, distinguishing consents from homes actually delivered.
Record changes to lending and deposit requirements, interest deductibility, bright-line rules and other tax settings, with dates, stated objectives and independent evaluations where available.
Document changes to tenancy law, bond and rent rules, and support programmes. Examine effects on tenants and landlords separately and avoid assuming an observed rent movement proves a policy effect.
Track eligibility, take-up, funding and delivery for assistance, affordable housing, public housing and accommodation support alongside market-wide outcomes.
Use official data for ownership, rents and household costs. For house-price indices and investment returns, document source coverage, methodology and any costs or assumptions added to the calculation.