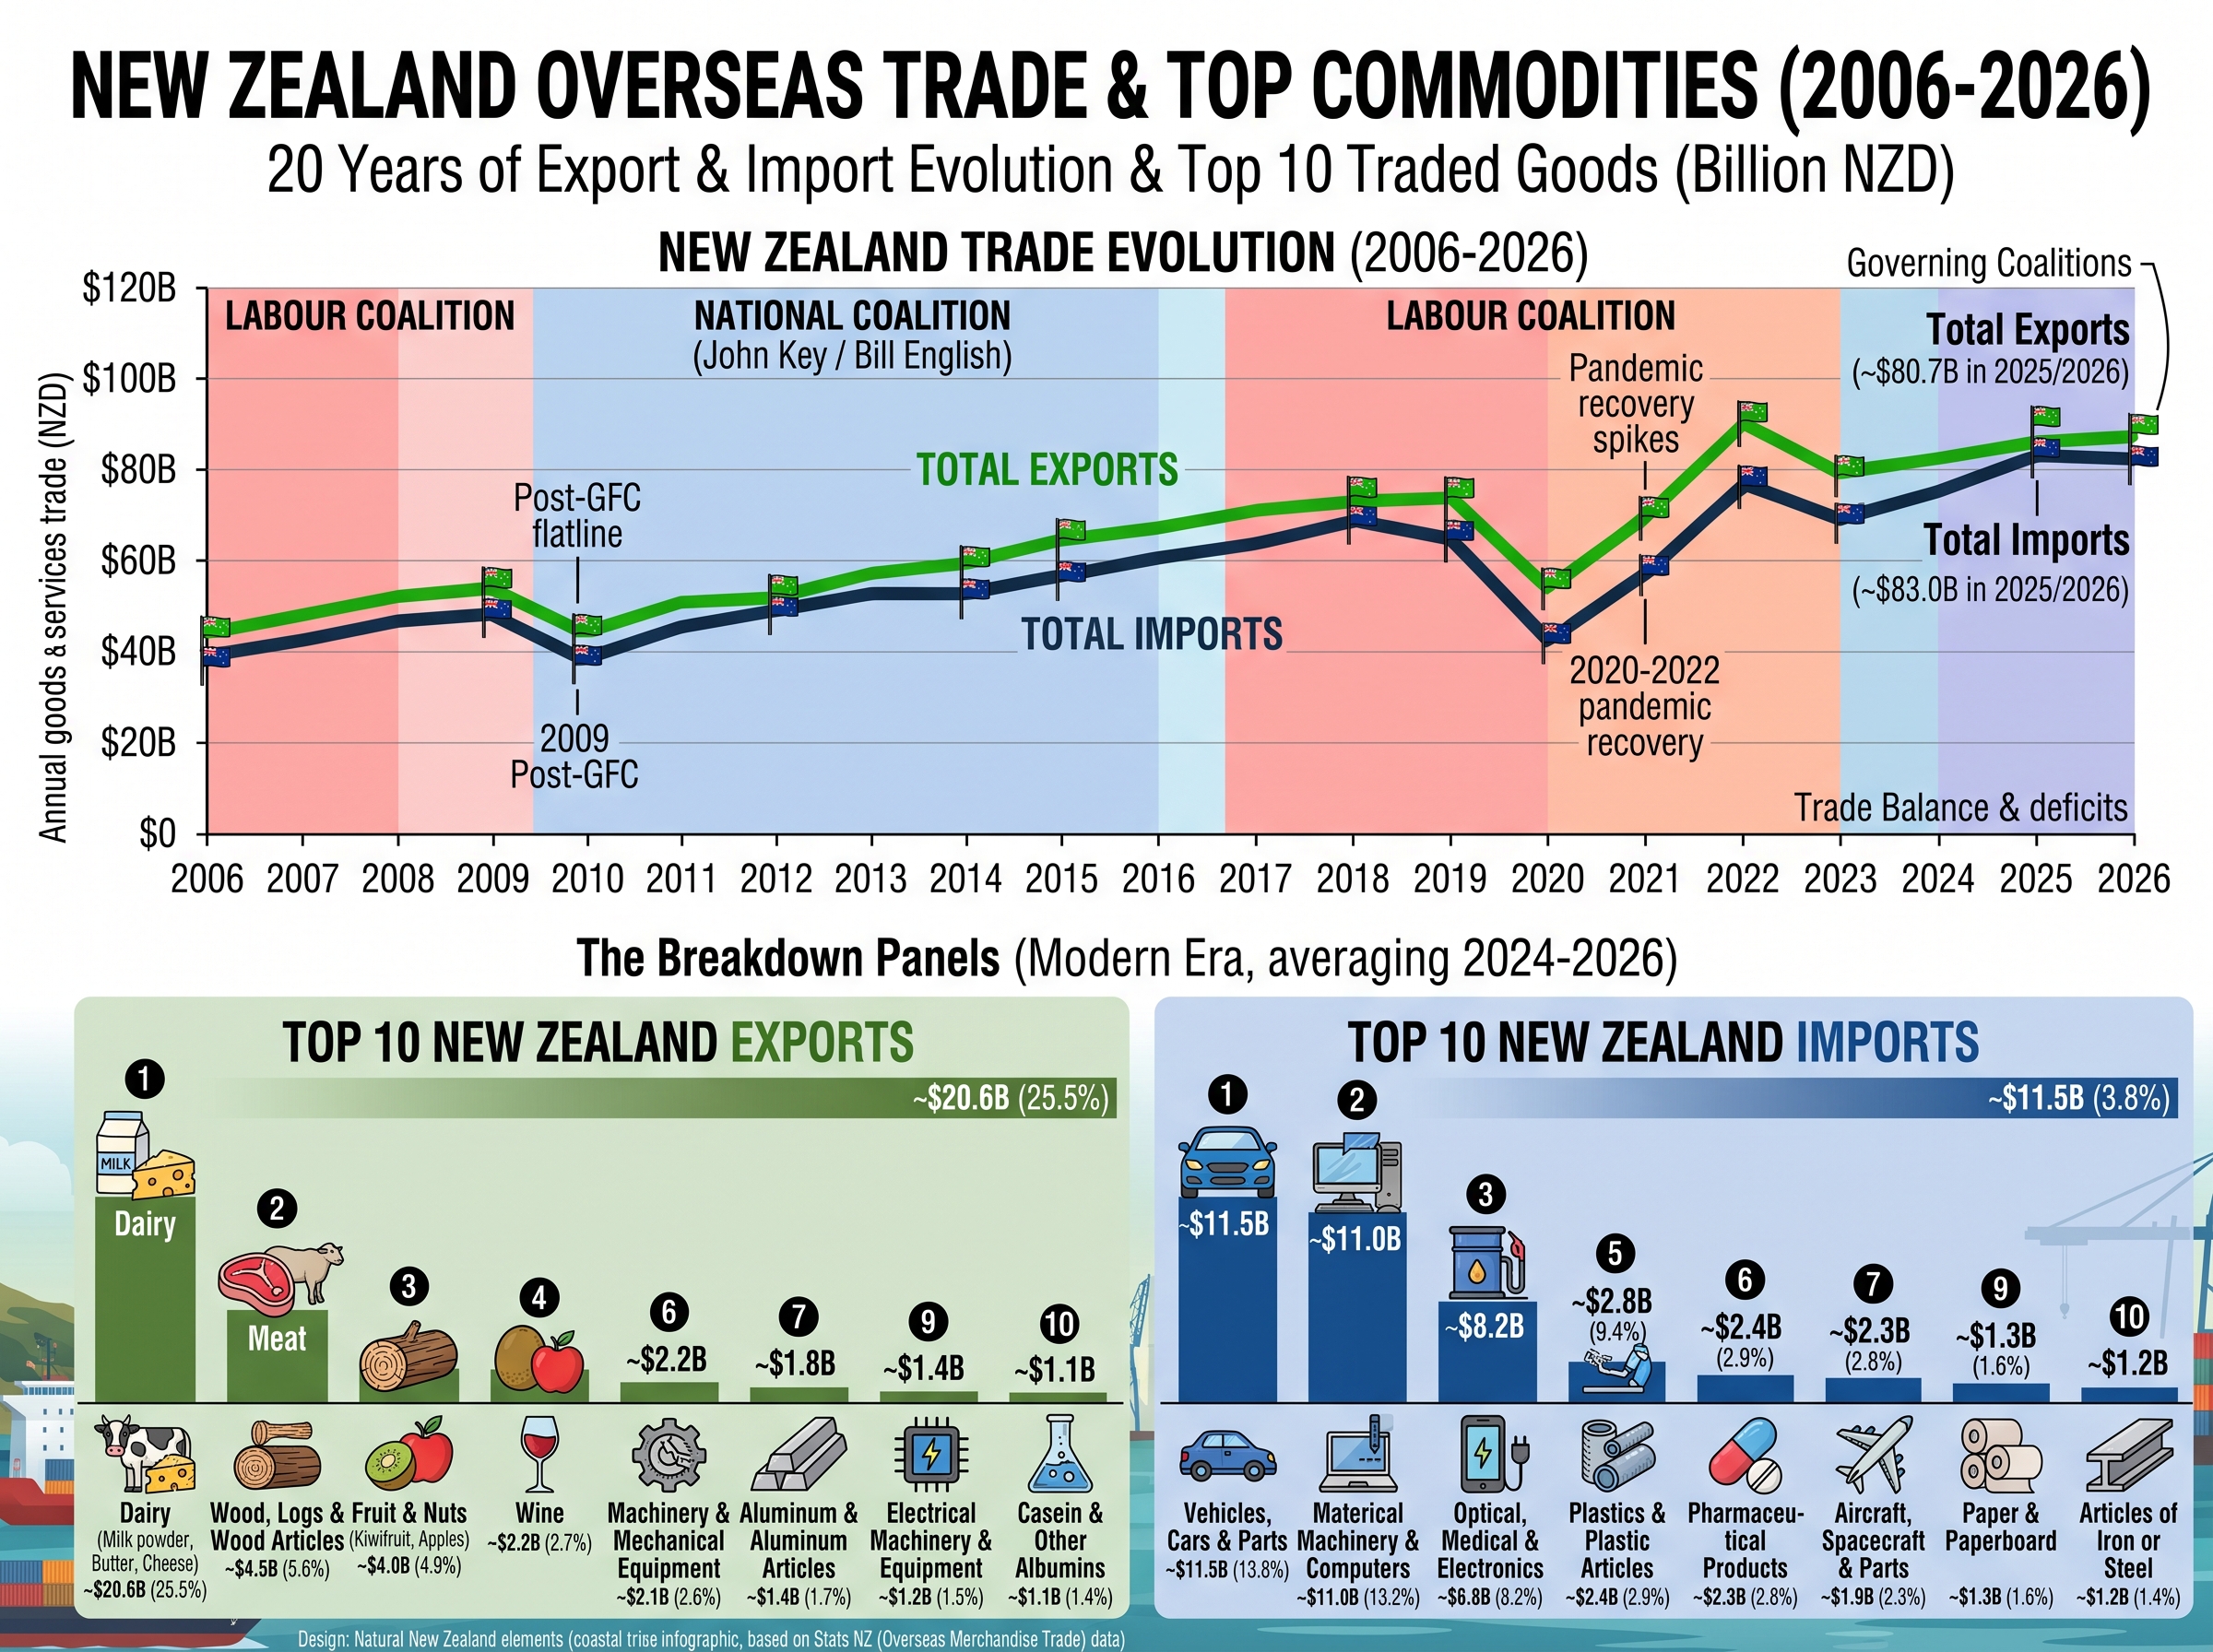
Compare the value of New Zealand’s exports and imports over time, then see how its major merchandise trading partners changed between 2006 and 2024. The pages distinguish total goods-and-services trade from merchandise trade by partner.
How to read this: The annual chart shows nominal current US dollars for goods and services combined. The partner rankings show merchandise (goods) only. Neither series adjusts for inflation, exchange-rate movement or changes in traded volumes, and endpoint rankings do not reveal every annual change.
A 20-year snapshot
This supplied illustration summarises trade trends. Read it alongside the sourced exports and imports chart and partner rankings below.
The figures, series definitions, annotations and source attributions in this image have not been independently verified. Use the sourced World Bank and UN Comtrade data below for specific values.
Exports and imports over time
World Bank national-accounts estimates show the annual value of exports and imports of goods and services, in current US dollars, from 2006 through 2024. Values are nominal: growth can reflect prices, quantities and exchange rates.
CURRENT US$ BILLIONS · ANNUAL
Trade values rose over the long run, with pandemic-era swings
US$64.6bExports · 2024
ExportsImports
Goods and services combined, current US dollars. Values are not adjusted for inflation.View all annual values
These are endpoint snapshots of New Zealand’s merchandise (goods) trade partners in 2006 and 2024, ranked by the reported US-dollar value of each flow. They are country/market rankings, not a ranking of exported or imported products.
Merchandise exports
Top export destinations
Rank
2006 partner
US$bn
2024 partner
US$bn
1
Australia
4.58
China
10.74
2
United States
2.95
United States
5.43
3
Japan
2.30
Australia
5.35
4
China
1.21
Japan
2.32
5
United Kingdom
1.10
South Korea
1.29
6
South Korea
0.86
Singapore
1.06
7
Germany
0.57
United Kingdom
1.04
8
Other Asia, nes
0.50
Indonesia
0.97
9
Belgium
0.41
Other Asia, nes
0.95
10
Indonesia
0.40
Malaysia
0.90
Merchandise imports
Top import sources
Rank
2006 partner
US$bn
2024 partner
US$bn
1
Australia
5.38
China
10.19
2
China
3.22
Australia
5.24
3
United States
3.09
United States
4.91
4
Japan
2.41
South Korea
4.14
5
Singapore
1.20
Japan
2.68
6
Germany
1.17
Singapore
2.36
7
Malaysia
0.78
Germany
1.93
8
South Korea
0.77
Thailand
1.78
9
United Kingdom
0.72
United Kingdom
1.40
10
Thailand
0.67
Malaysia
1.37
Source: UN Comtrade data portal (reporter New Zealand, HS total, 2006 and 2024; exports and imports). Values are rounded to US$0.01 billion. “Other Asia, nes” is the partner label in the source classification and is not a country attribution. Ranks are calculated within each year and flow; differences in rank/value do not establish why trade changed.
How to read the trade changes
2006–2019
Trade values grow in nominal terms
Both exports and imports are higher by 2019 than in 2006 in current US dollars. This comparison does not show real volume growth, since inflation and exchange rates affect the dollar values.
2020–2021
A sharp disruption, then uneven rebound
The annual value of both trade flows fell in 2020 and rebounded in 2021. This series alone cannot separate supply-chain disruption, commodity prices, quantities, freight costs or currency movements.
2022–2024
Imports exceed exports in nominal value
Imports were above exports in current US dollars in each of 2022–2024. A nominal trade gap is not by itself a measure of household wellbeing, productivity, resilience or the value of particular trade arrangements.
Partner mix
China rises in the endpoint rankings
China ranked fourth among merchandise export destinations and second among import sources in the 2006 snapshots; it ranked first in both 2024 lists. The endpoint comparison does not show the path between years or the product mix behind the change.
Evidence to follow
A fuller assessment should pair nominal values with inflation-adjusted values and trade volumes, cover services by destination, identify leading commodities, and examine concentration, supply-chain exposure and the distribution of gains and costs.