A longer view 2006 — 2026Economy · spending · choices
20 YEARS OF CONTEXTONE SHARED FUTURE
Economy · quick facts
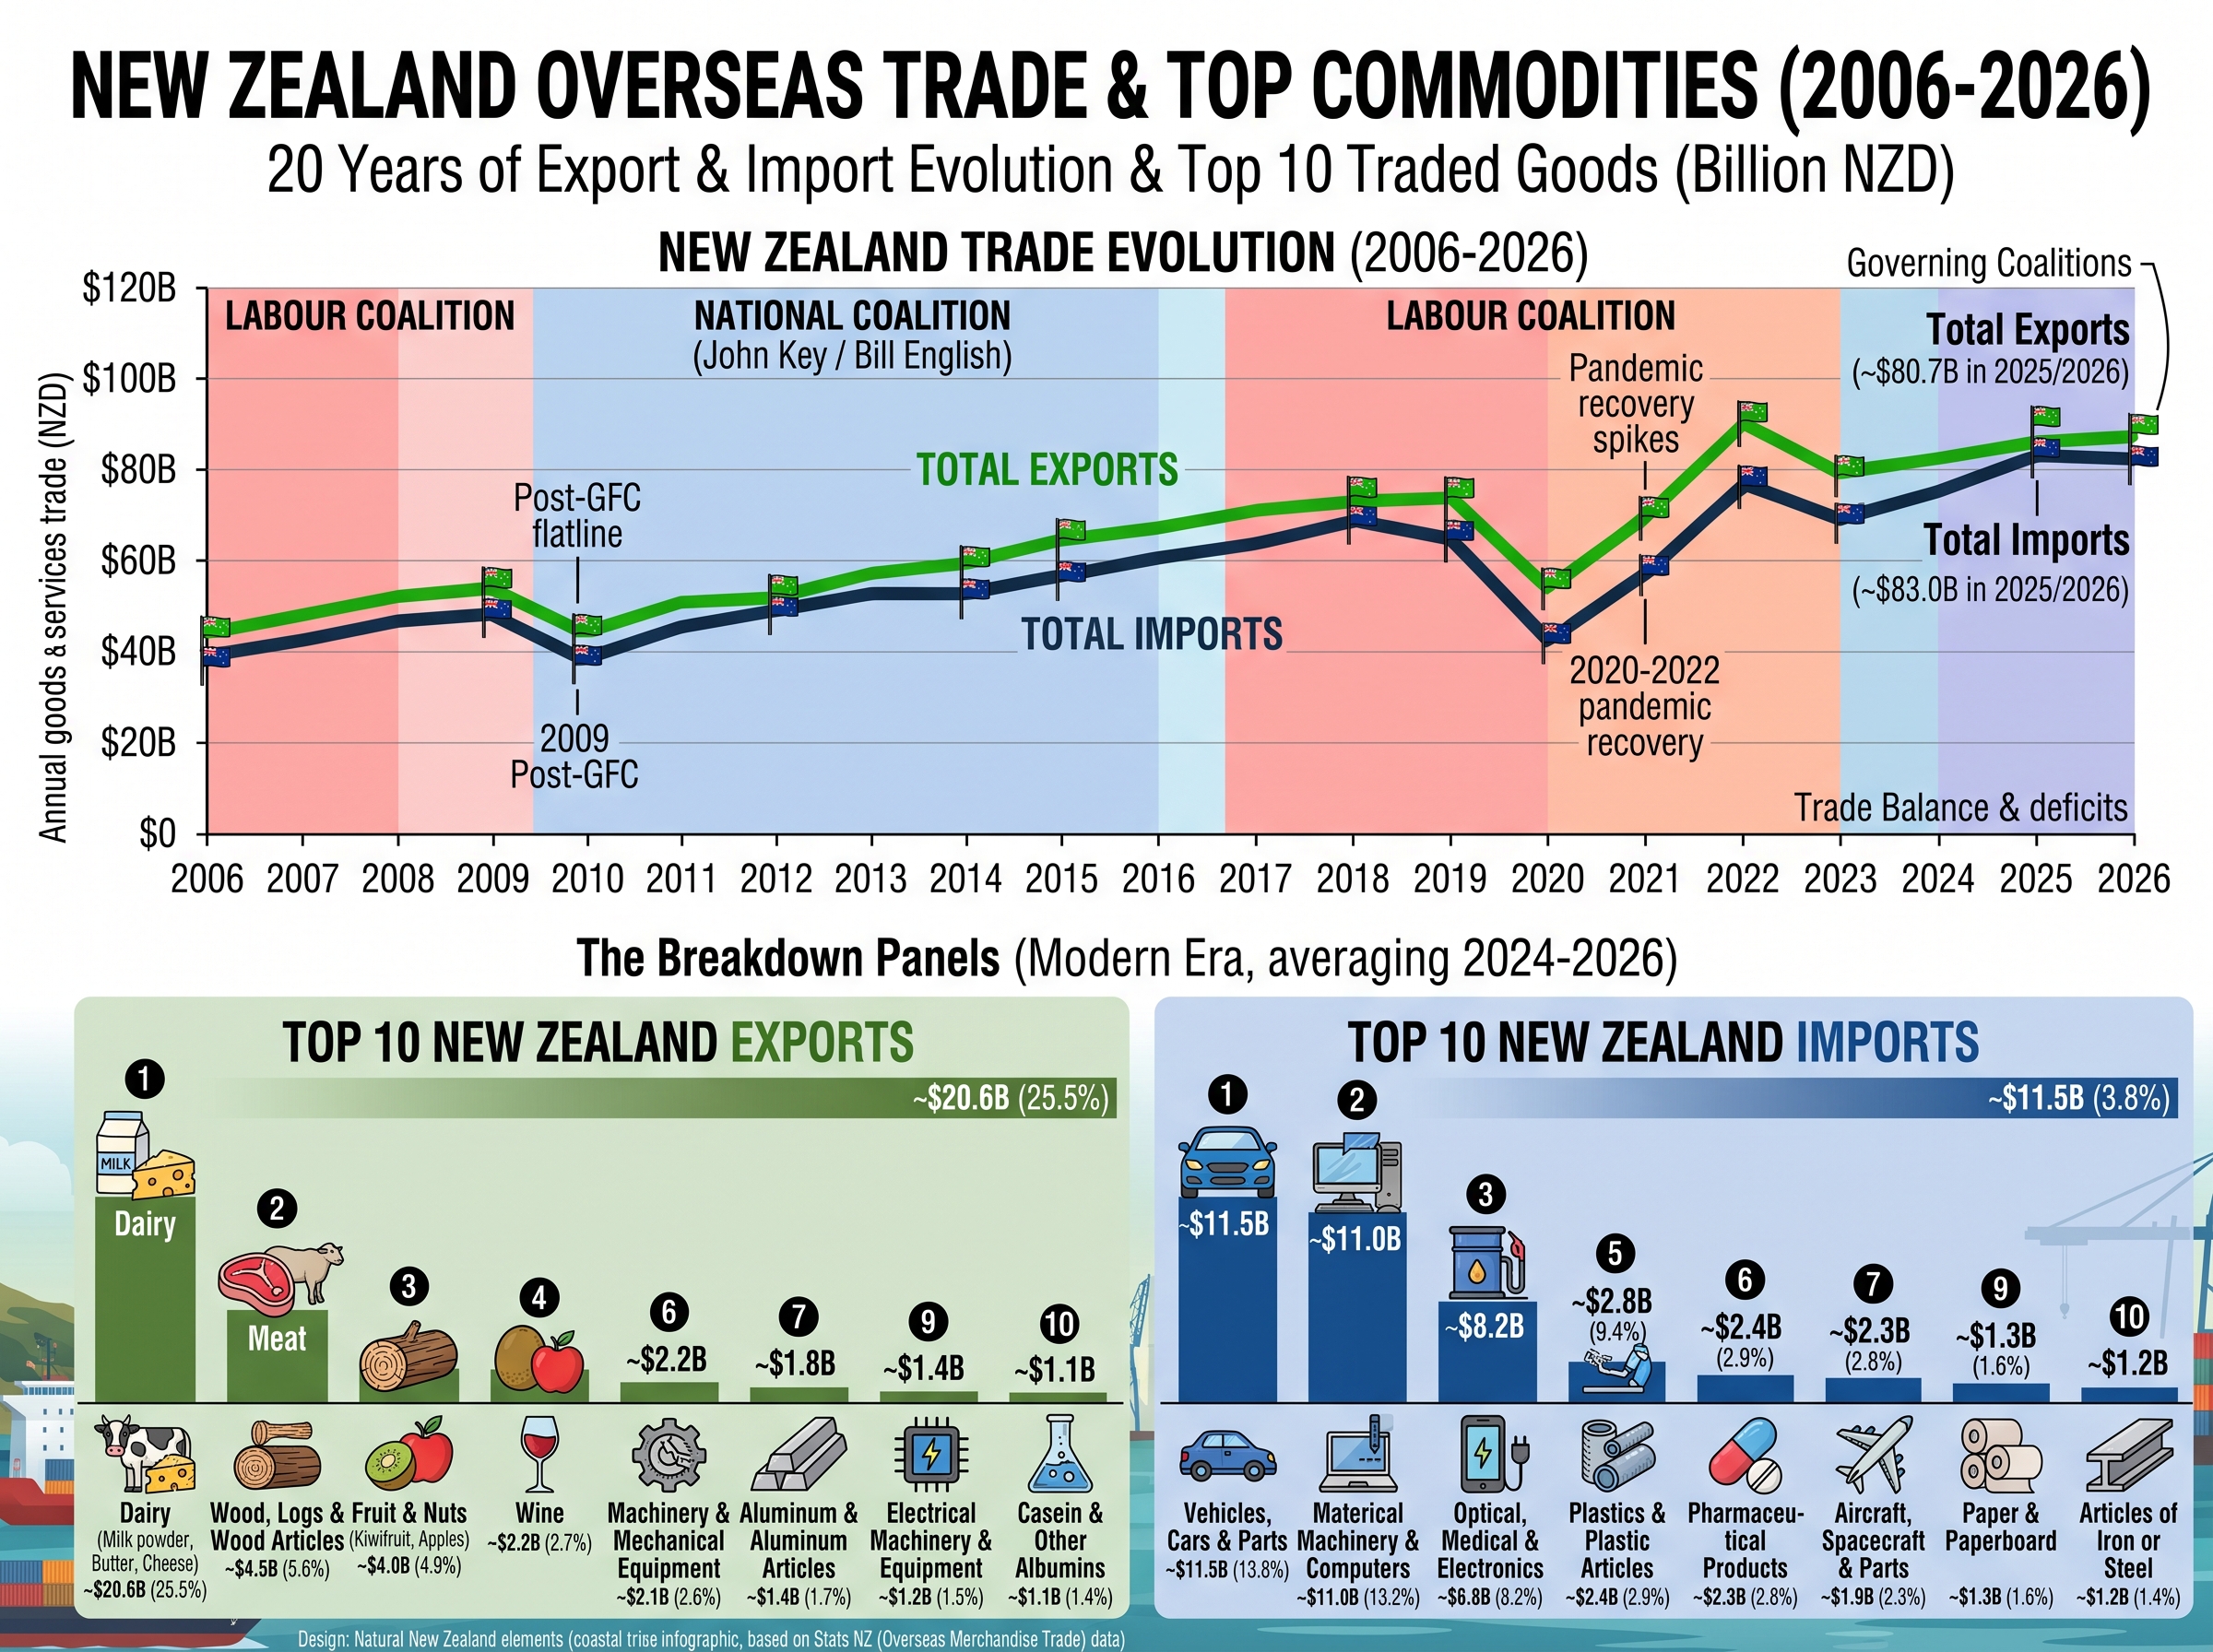
2024 exports: US$64.6b; imports: US$67.9b. Unemployment was 5.6% in the June 2026 quarter. The figures are from different measures and periods; neither alone describes household prosperity.
RNZ reports concern about rising nitrate in drinking-water sources and a debate over agricultural land use, dairy consents, water treatment, and who should pay. The article notes health effects are still being reviewed; reported concerns should not be treated as settled conclusions.
Policy questions
Monitoring and health: Are drinking-water standards and long-term health research keeping pace with new evidence?
Pollution and costs: How should farm practices, catchment limits and water-treatment costs be balanced and enforced?
RNZ reports the Cambridge–Piarere Expressway is estimated to take five years and cost $1.8 billion; the Prime Minister challenged NZTA to accelerate delivery, while the agency cited project constraints and called an 18-month target ambitious.
Policy questions
Value and accountability: How should project estimates, schedule changes and benefits be independently tested and reported?
Safe delivery: Can procurement and consenting be improved without compromising safety, environmental requirements or community input?
RNZ reports the inquiry into fatal Tauranga landslides was extended after delays in receiving information from participating agencies, among other scheduling pressures. Eight people died in the January slips.
Policy questions
Preparedness: Do agencies have clear duties, data-sharing processes and capacity to respond quickly to major hazards?
Learning and prevention: How will inquiry findings translate into transparent actions on land-use planning, warnings and emergency response?
RNZ reports 1,877 schools received $86 million through the government donation scheme this year, with some schools remaining under a grandparenting provision after their equity-index measure changed. Schools described the scheme as predictable funding that can ease pressure on families.
Policy questions
Fair targeting: How should eligibility reflect changing community need without creating abrupt funding swings?
Family costs: Does the scheme reduce pressure to contribute, and are schools adequately funded for core learning and activities?
RNZ reports the agreement has begun. The Trade Minister said 57 percent of exports to India are tariff-free now, with that share expected to rise over time; the reported figures and forecast are attributed to the Minister.
Policy questions
Export outcomes: Which sectors and firms actually gain market access, and how will export growth be measured?
Wider effects: What are the implications for workers, consumers, standards and New Zealand’s trade diversification?
RNZ reports Te Pāti Māori MP Oriini Kaipara defended visiting a Mongrel Mob pad, saying she sees whānau; National leader Christopher Luxon described gangs as a source of serious harm, while Labour leader Chris Hipkins rejected restoring gang mana or changing the patch ban. The report also raises violence against women, drug harm, victims’ safety and claims about intergenerational trauma linked to state care.
Policy questions
Safety and accountability: Which measures reduce violence, drug supply and gang recruitment, and how are victims protected?
Prevention and justice: What is the evidence on early intervention, treatment and rehabilitation, and how do enforcement and imprisonment affect reoffending and Māori over-representation?
This selection reflects recent RNZ reporting, not a ranking of importance. Summaries attribute claims to the report or named source; the questions are prompts for evidence-based policy discussion, not conclusions about cause or effectiveness.
Start with the evidence
The big picture, made easier to see.
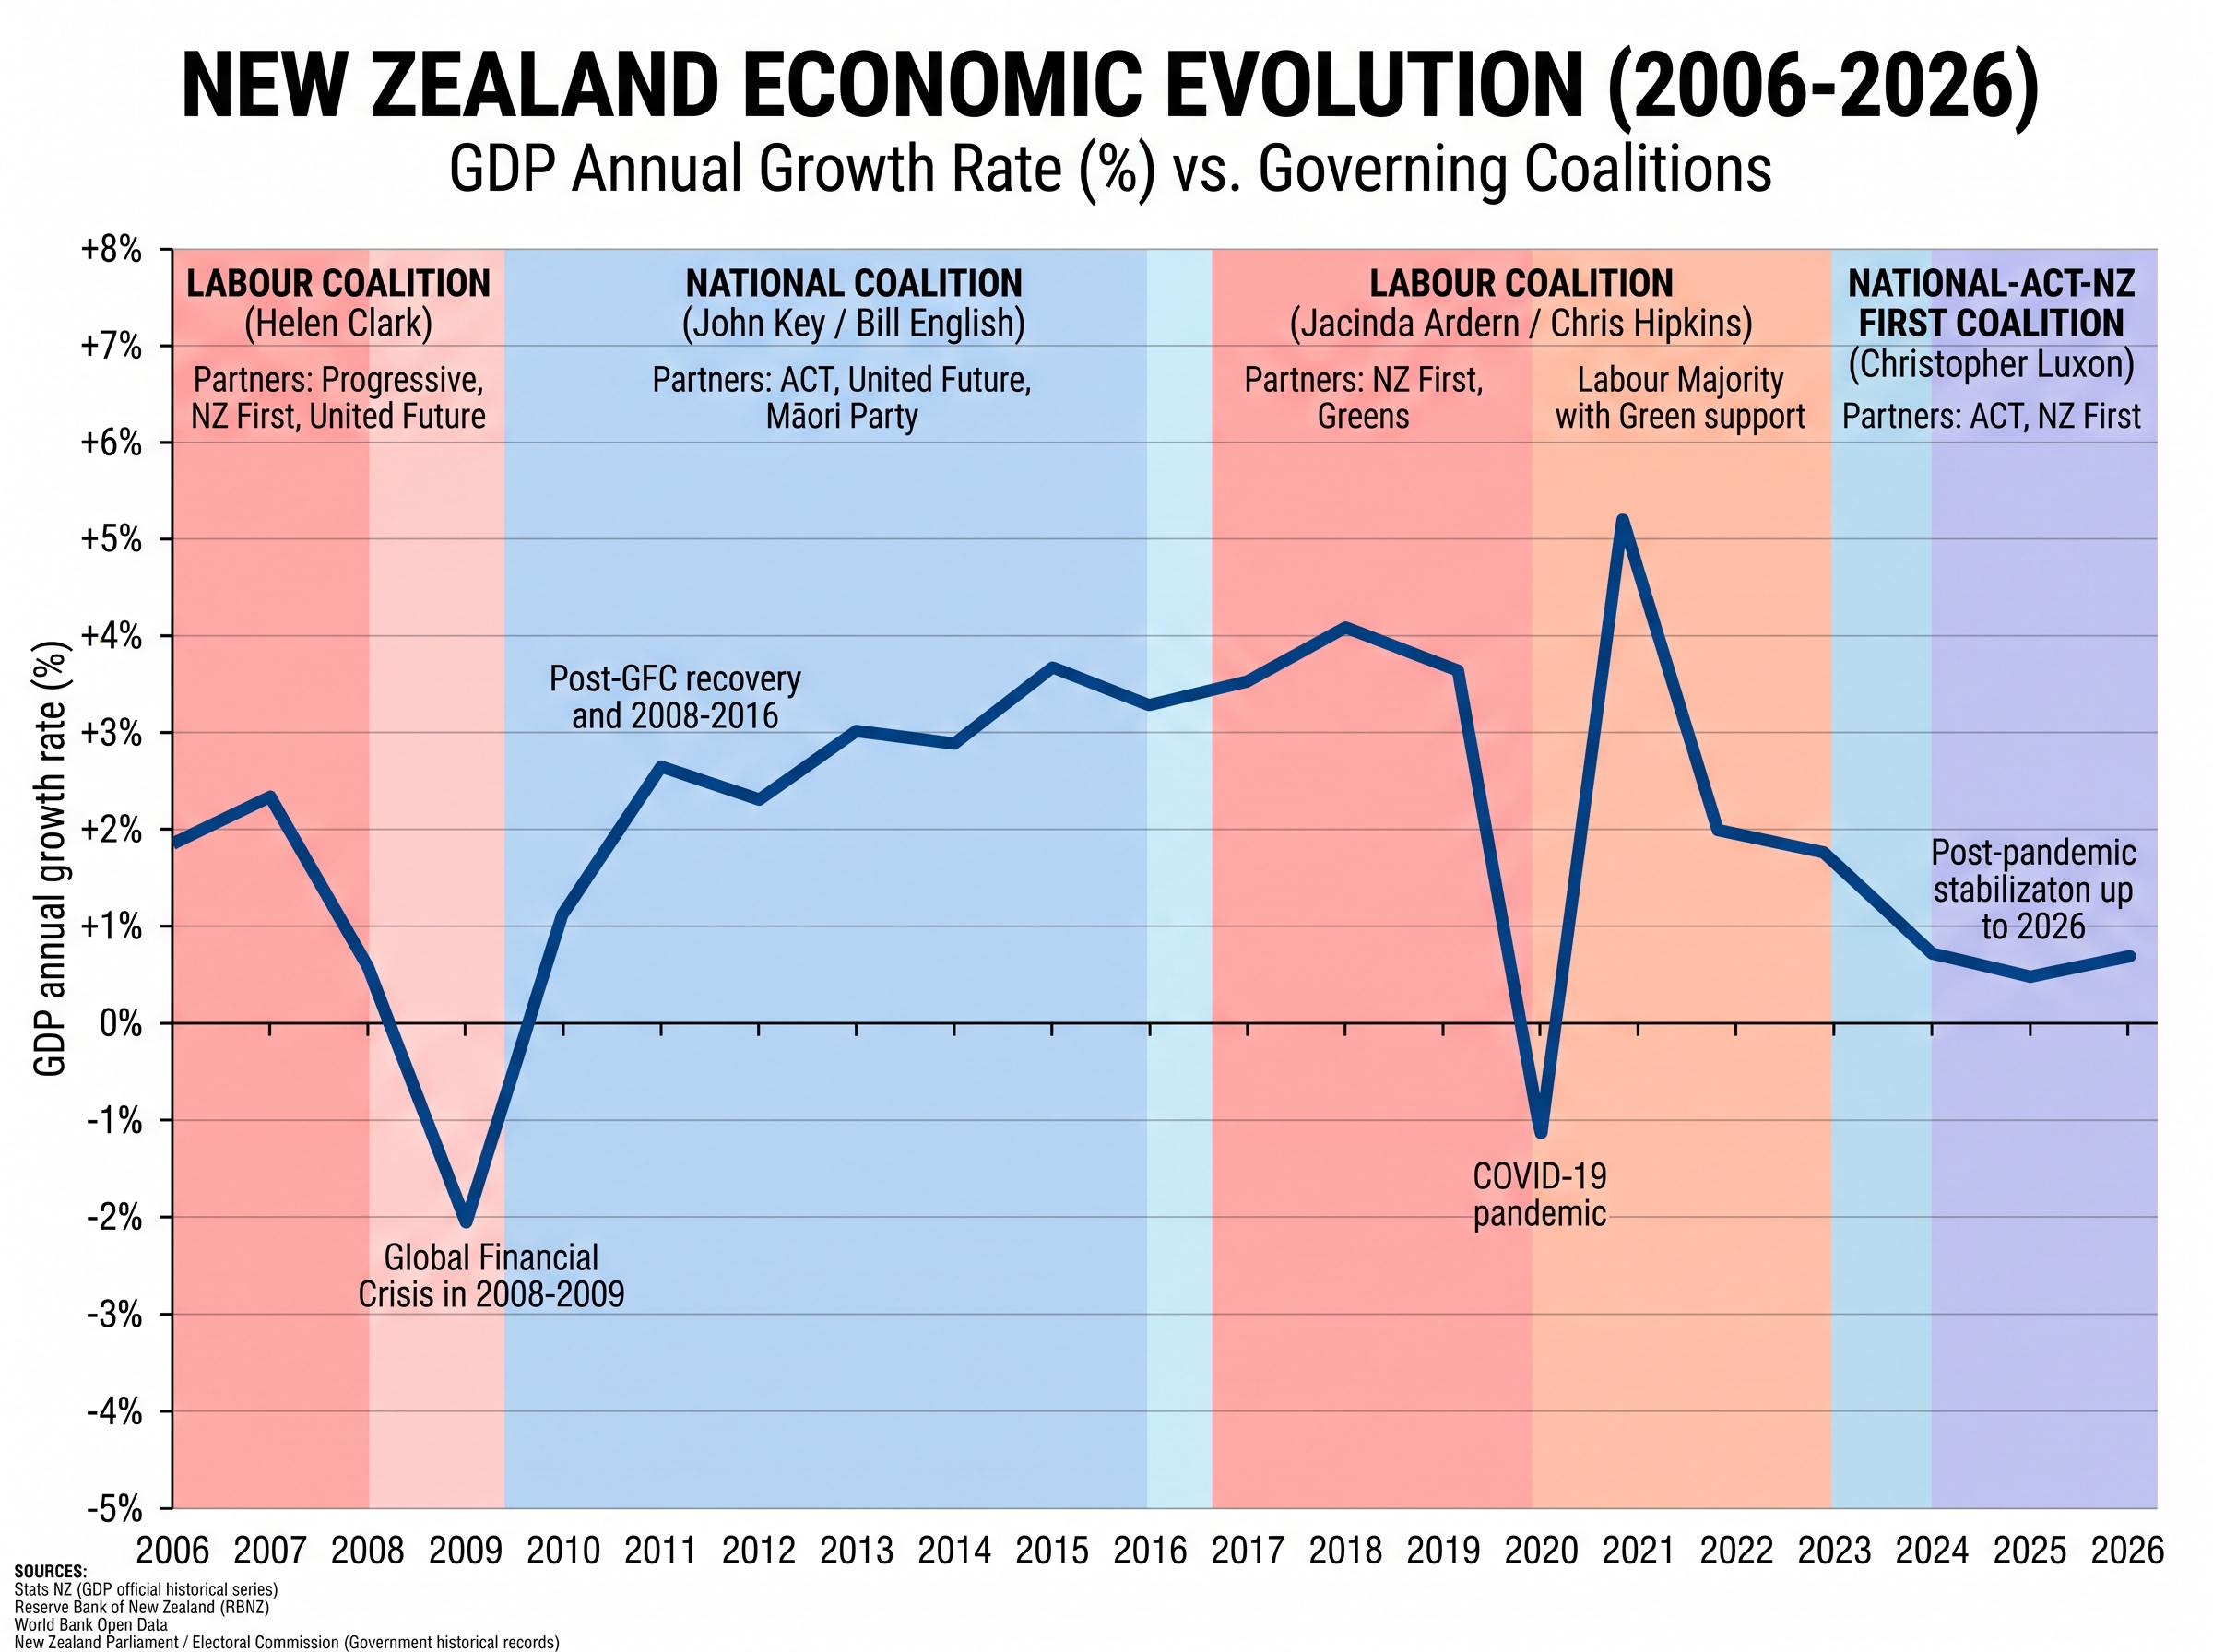
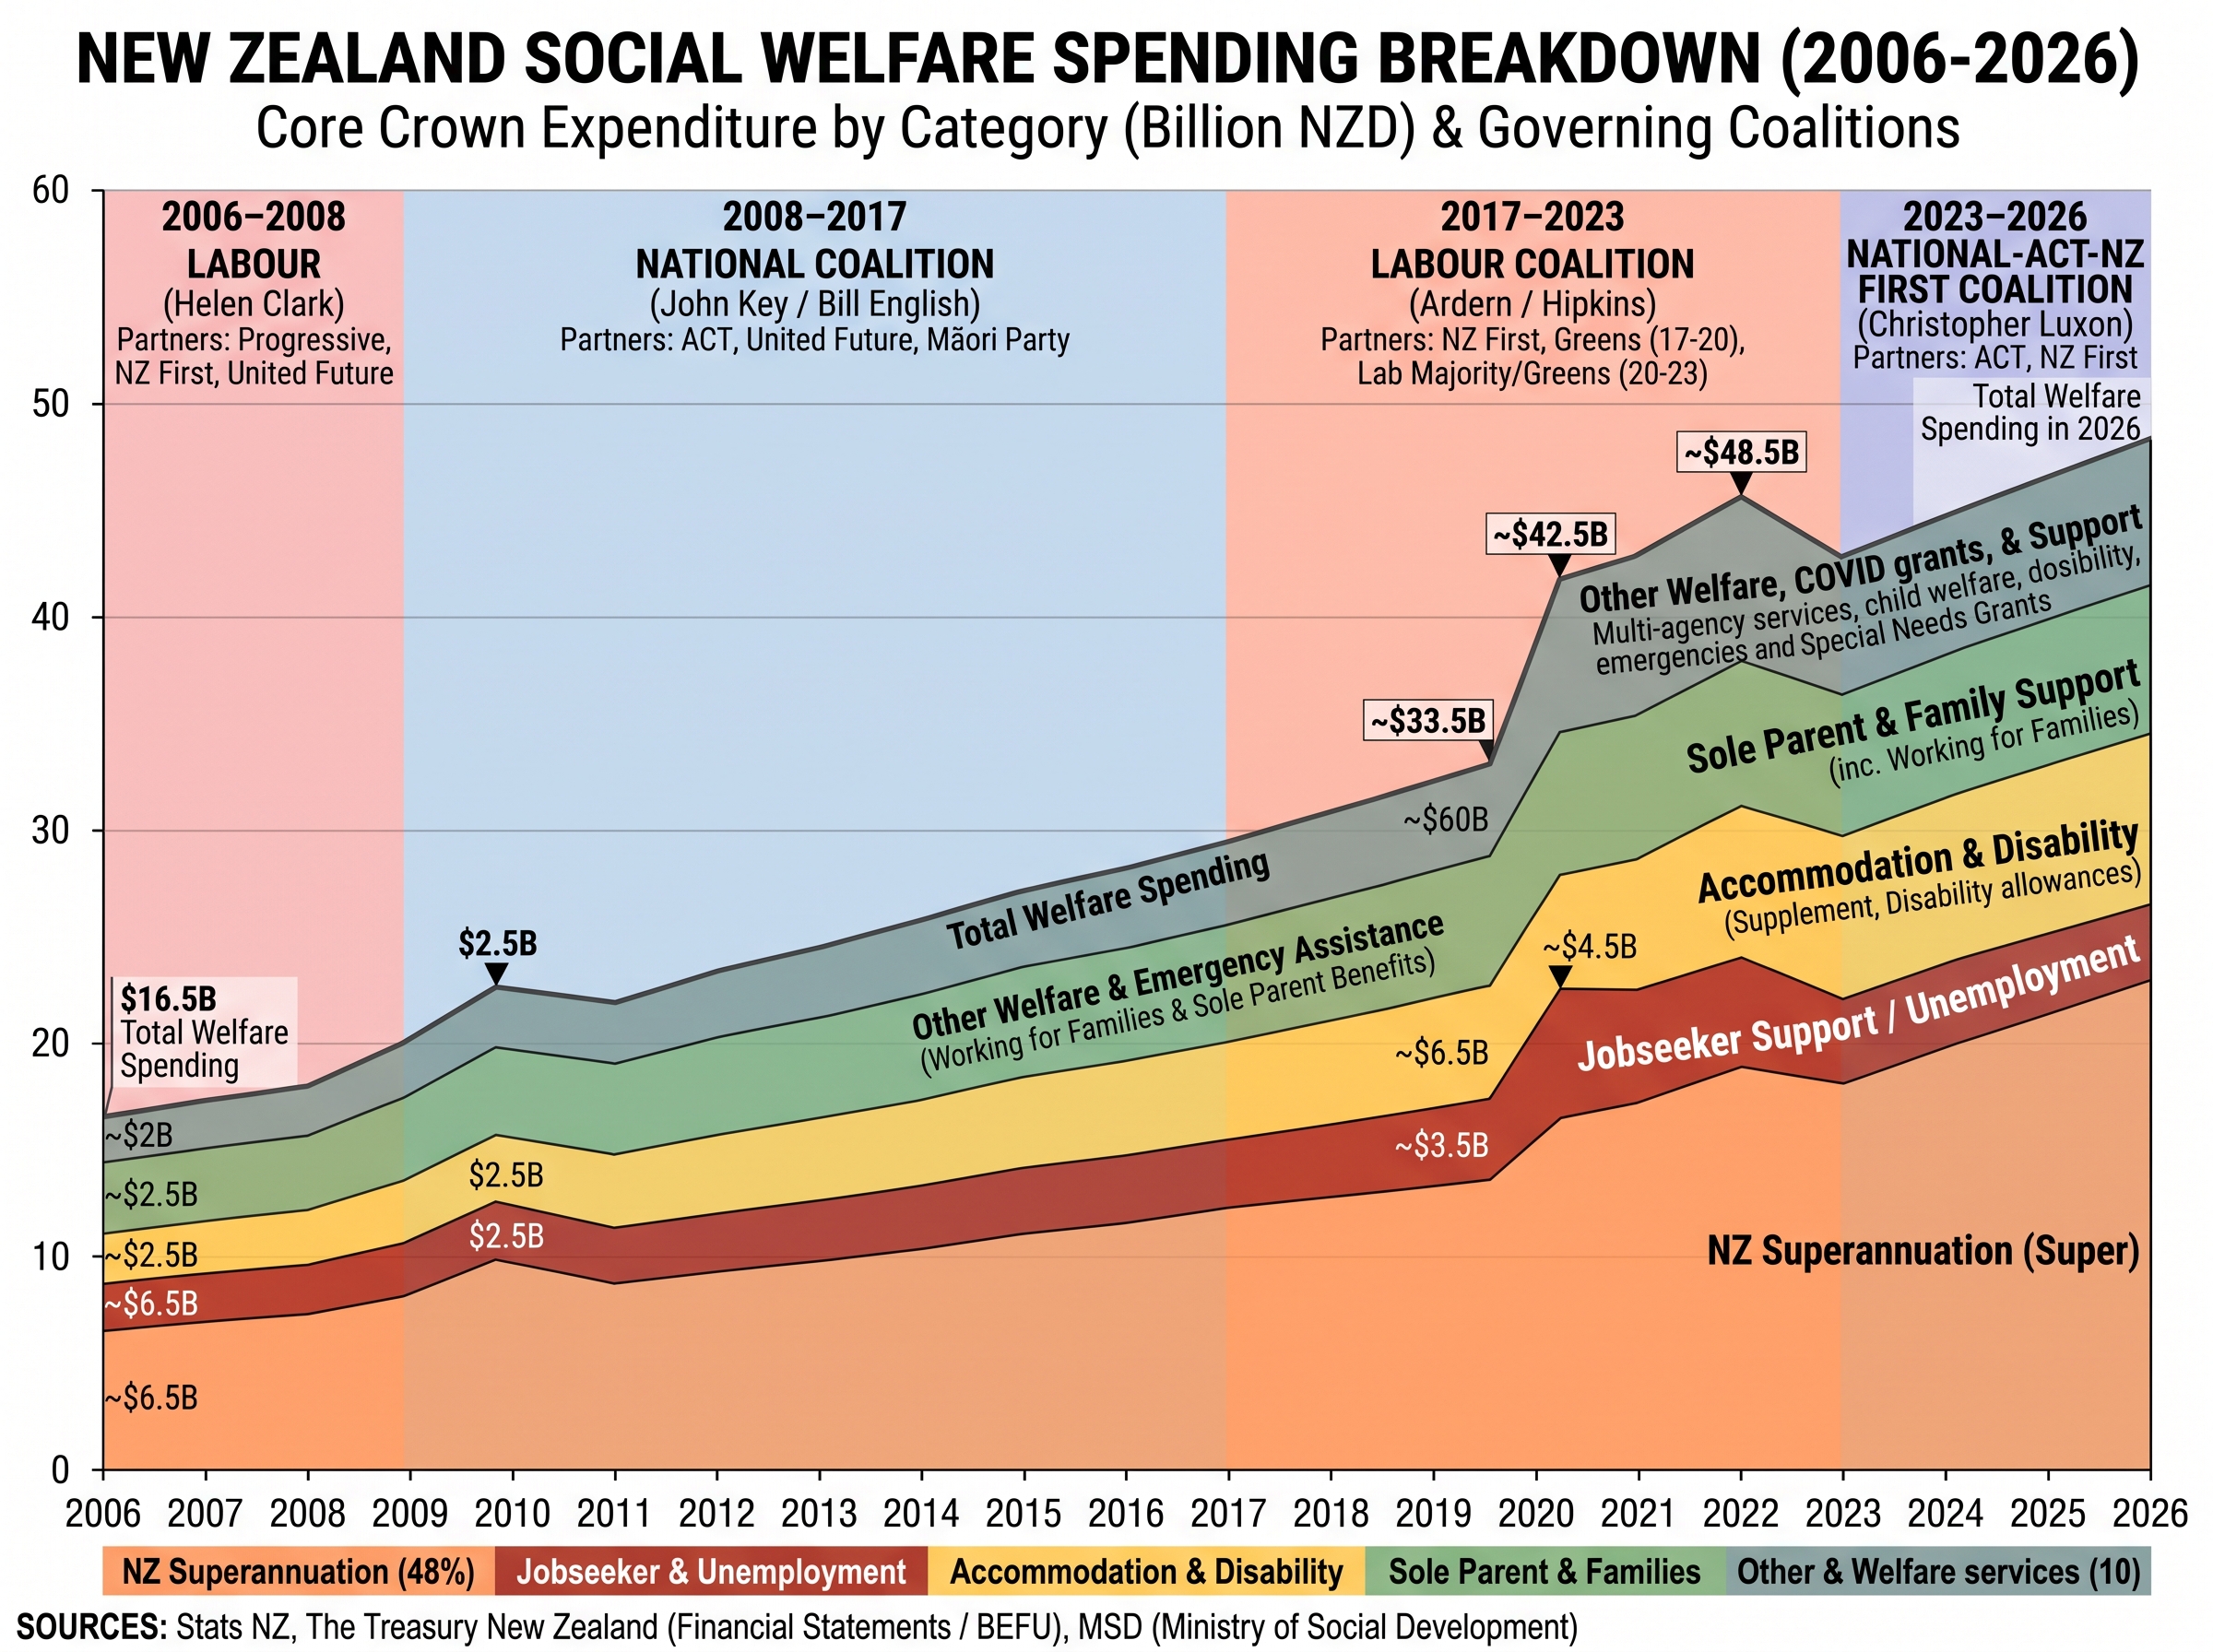
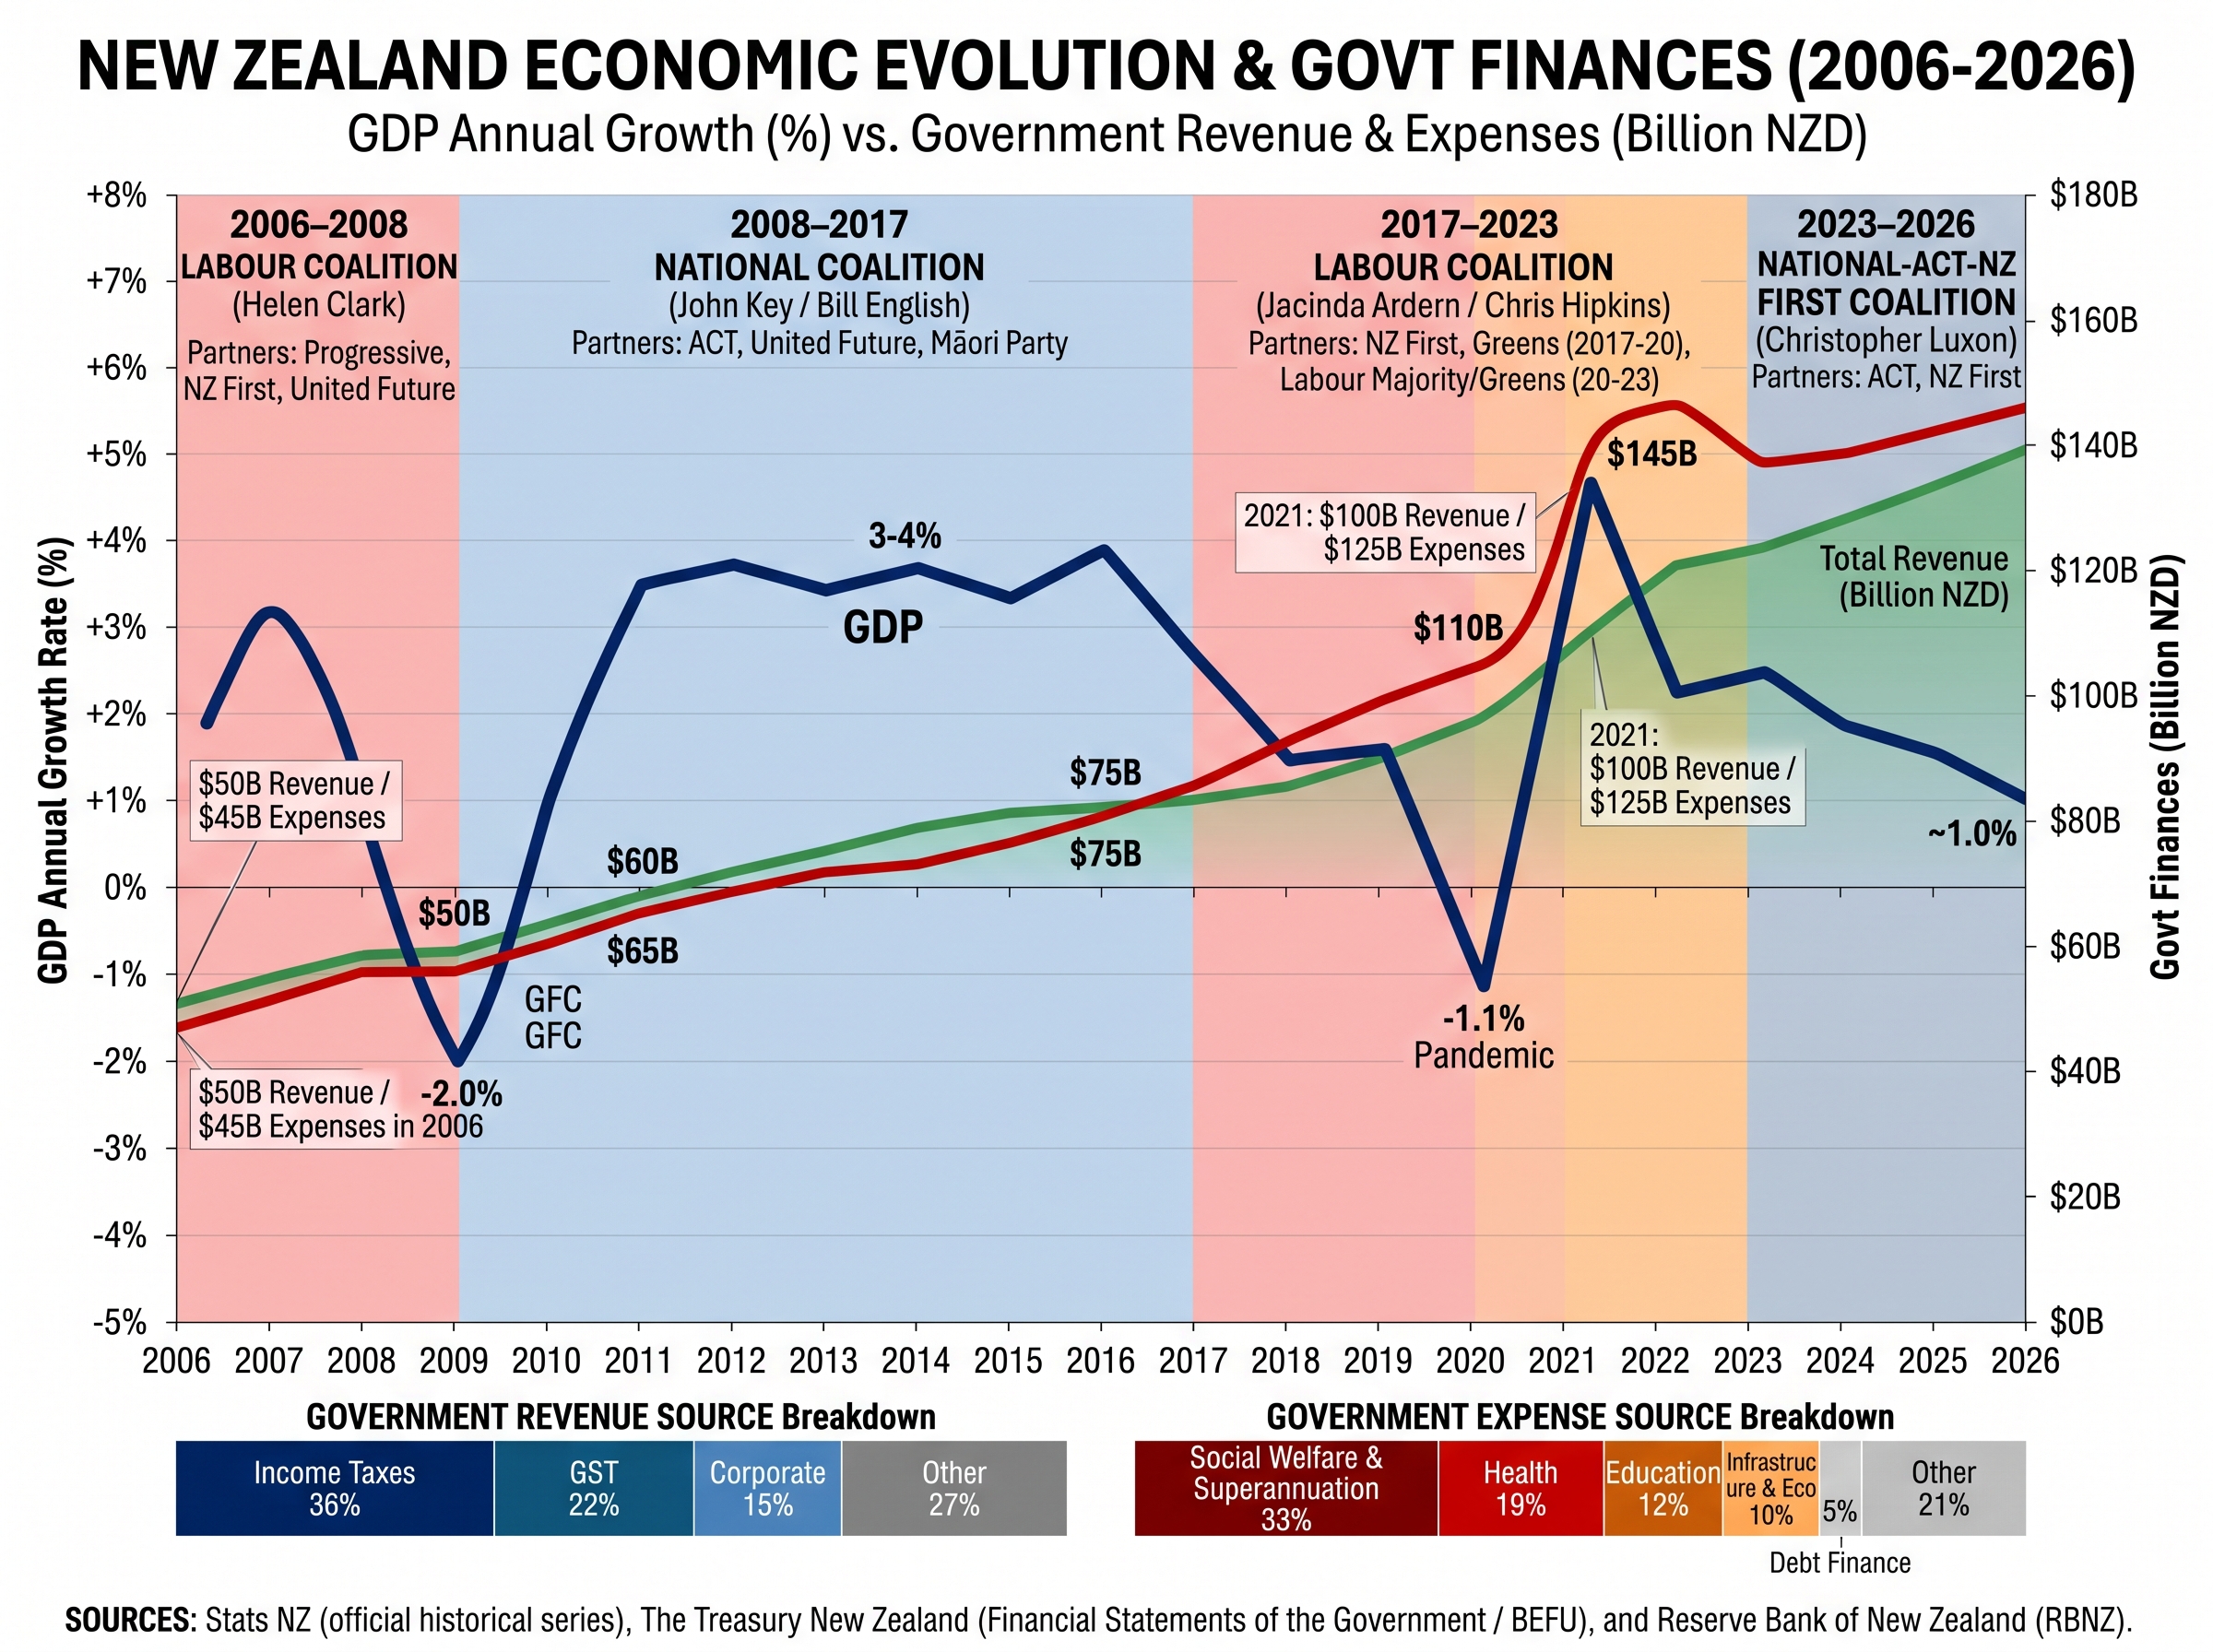
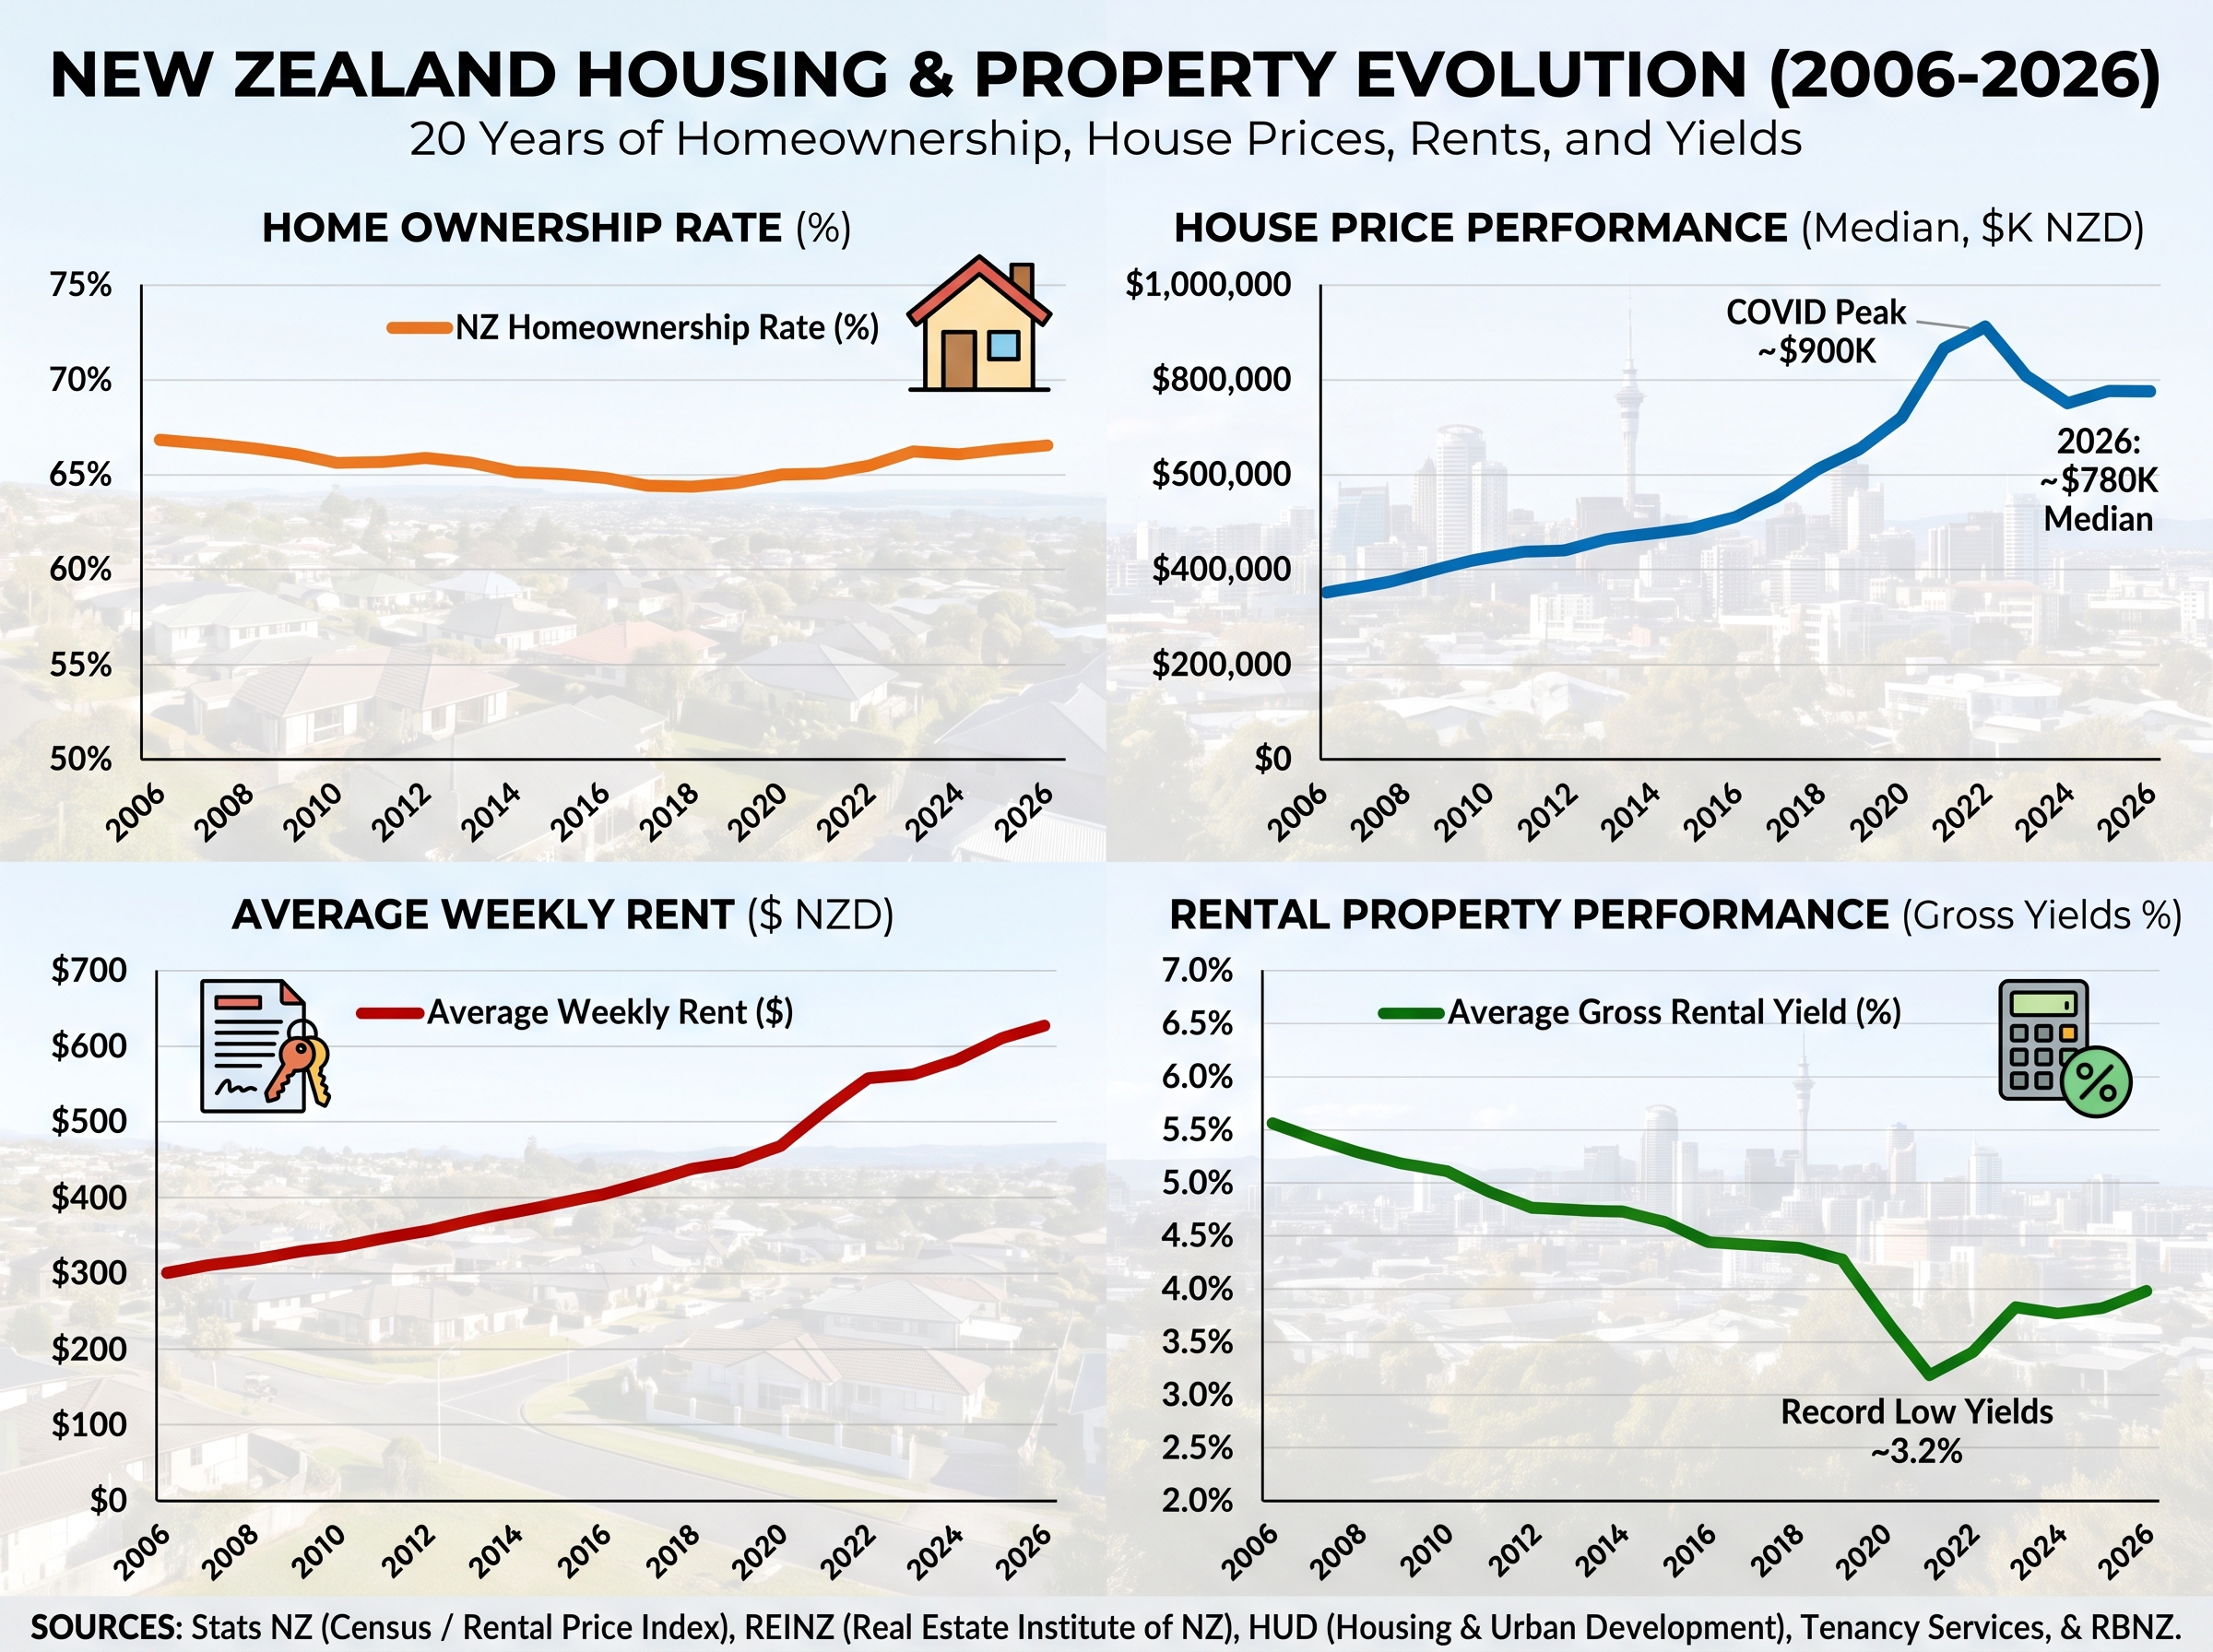
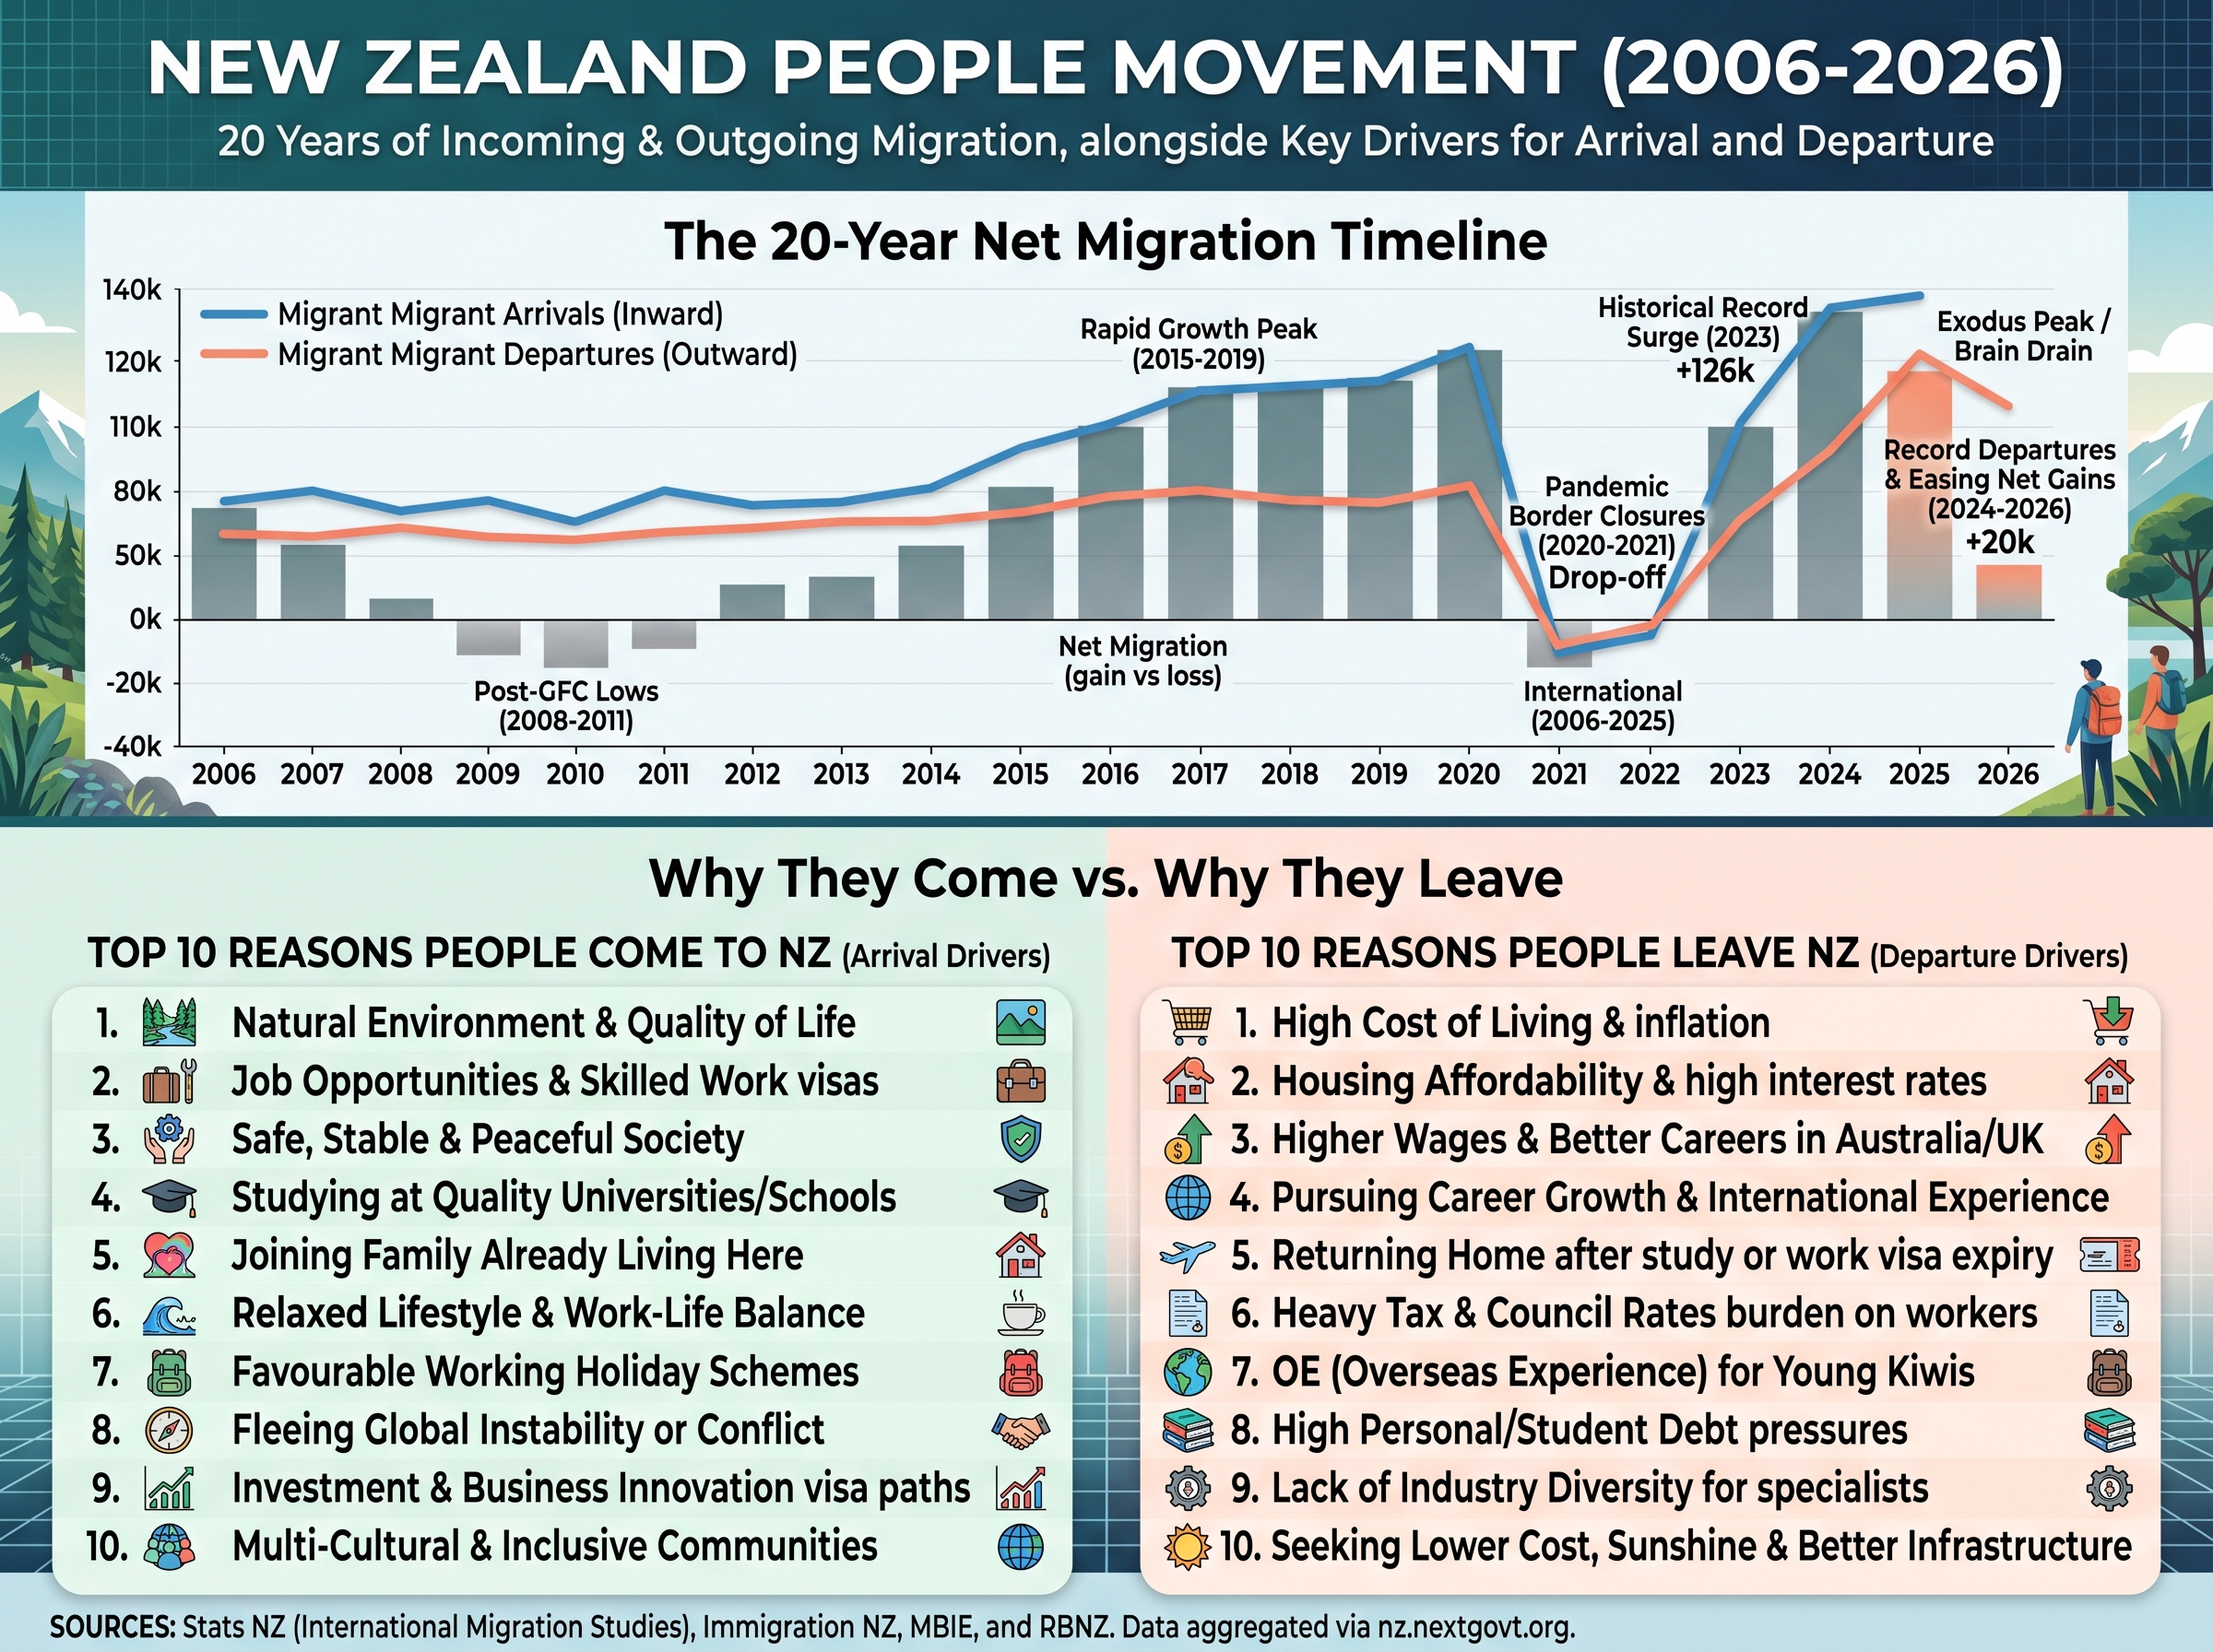
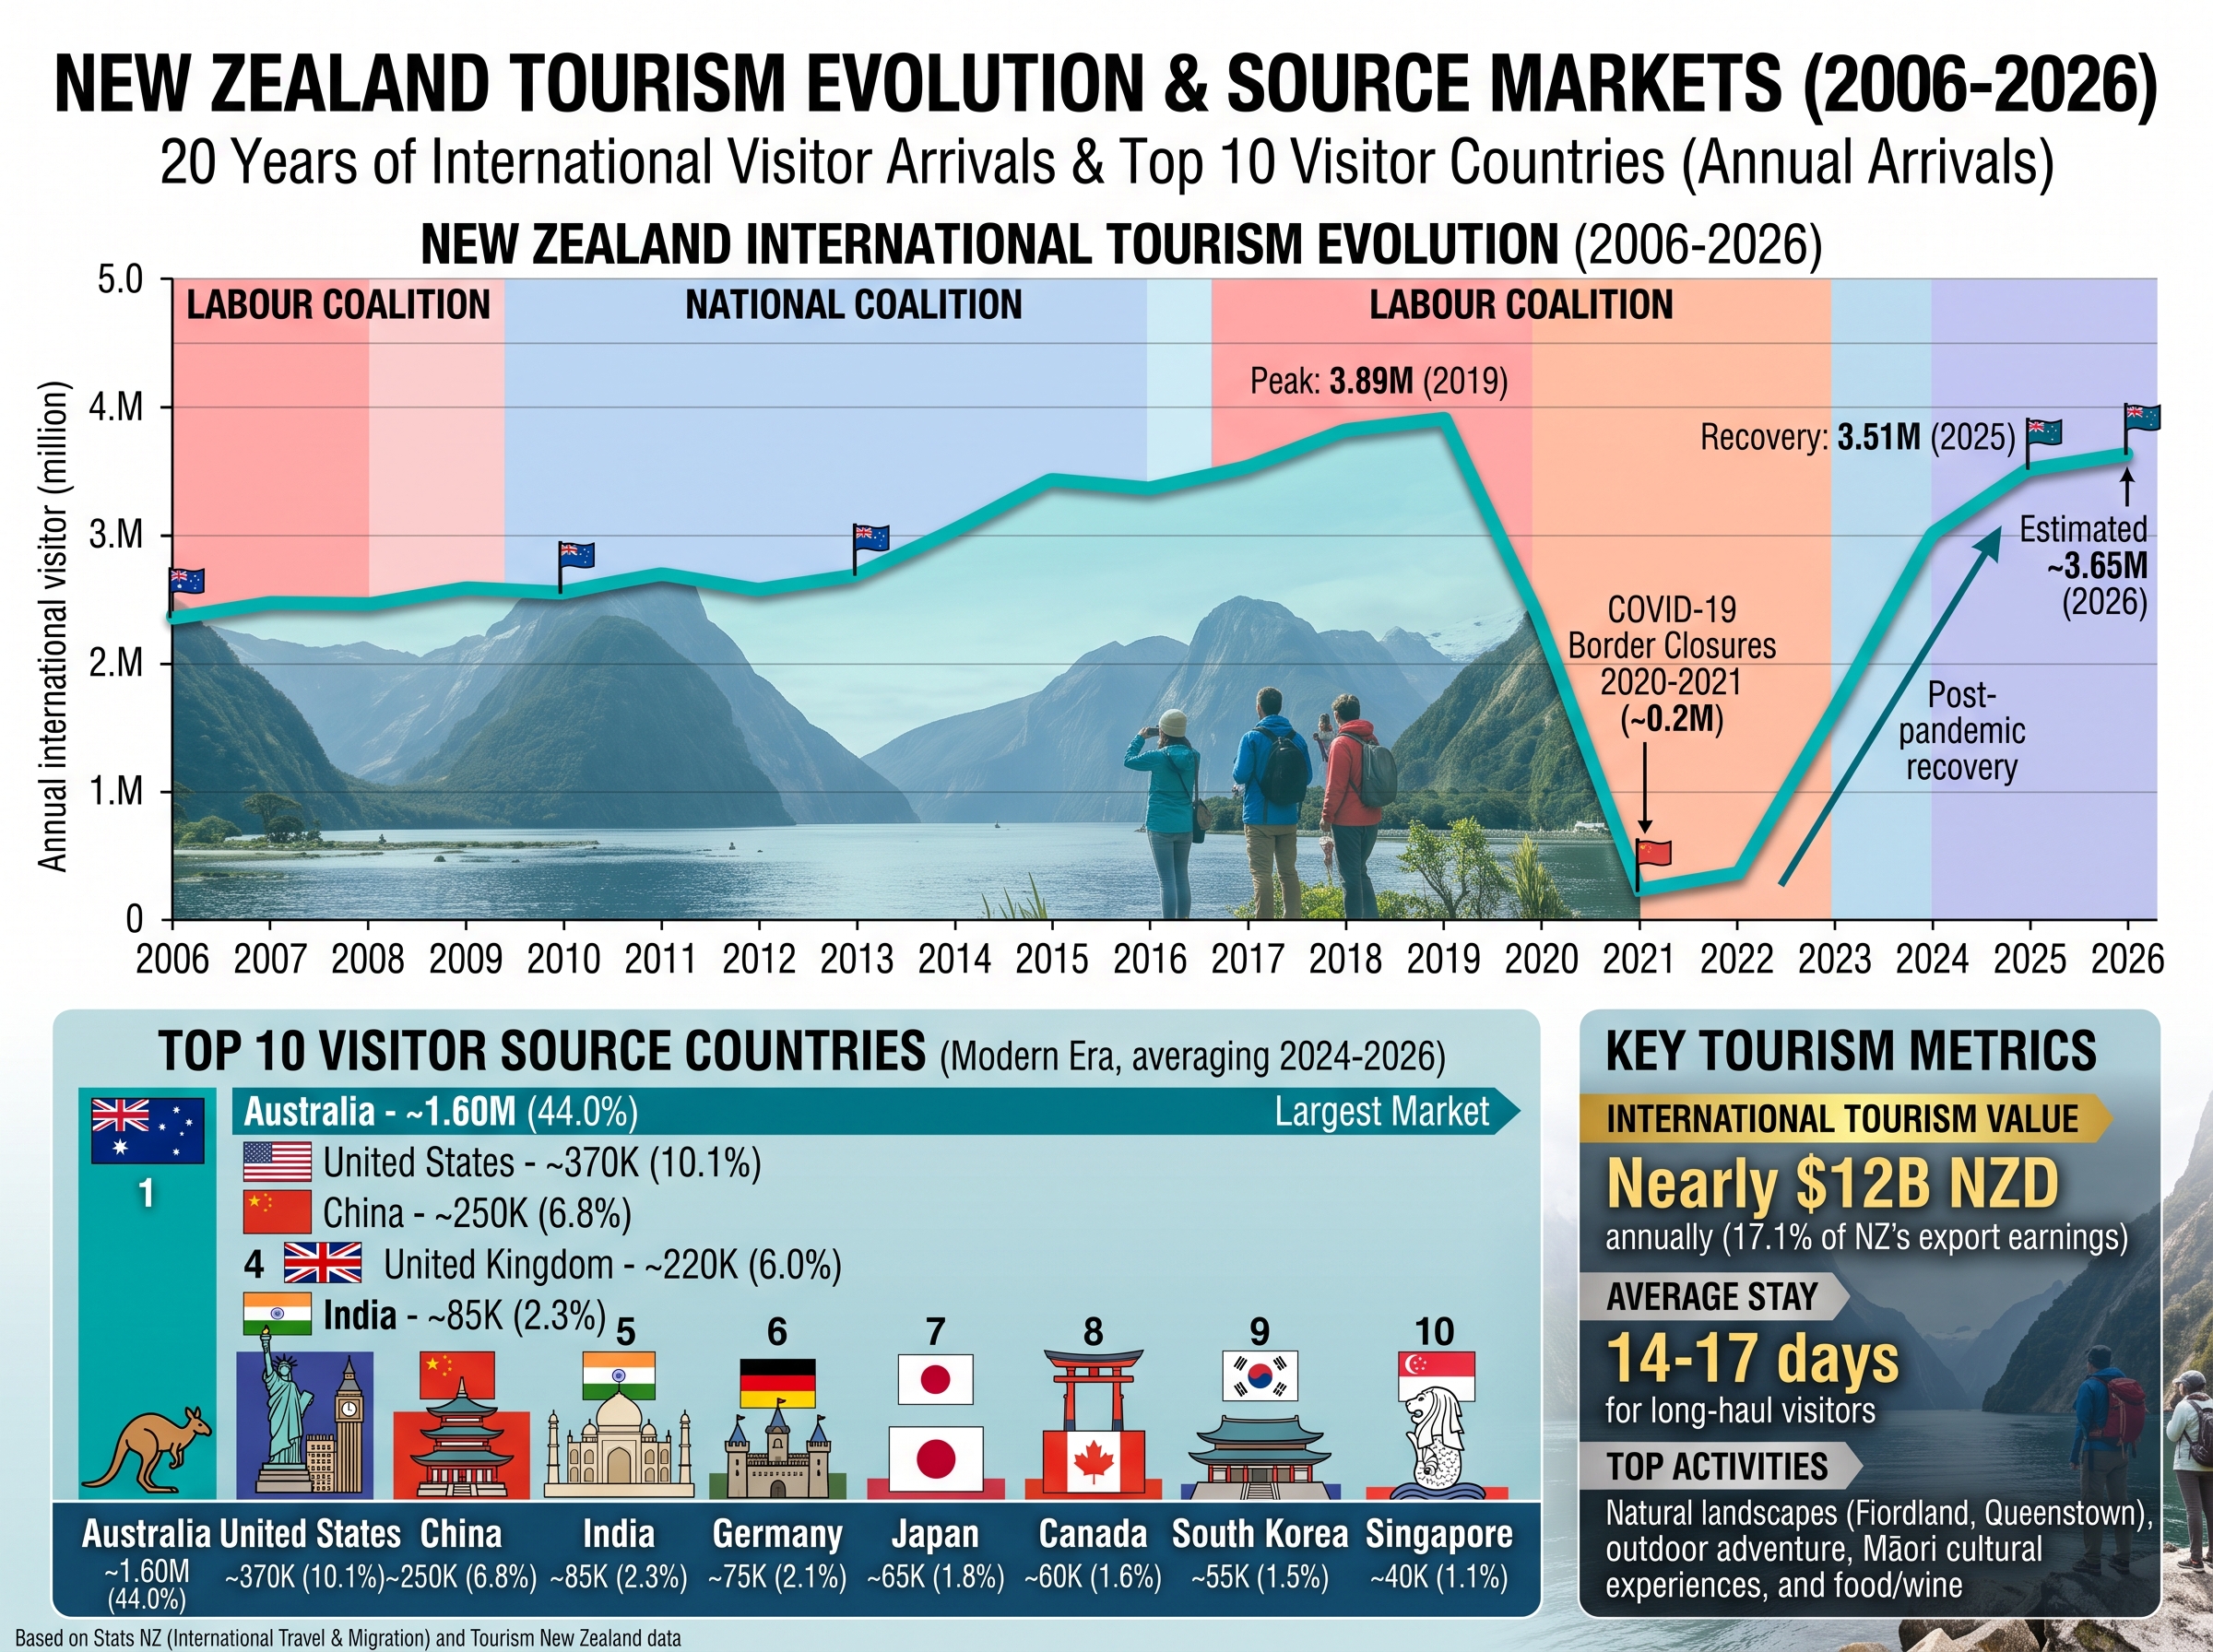
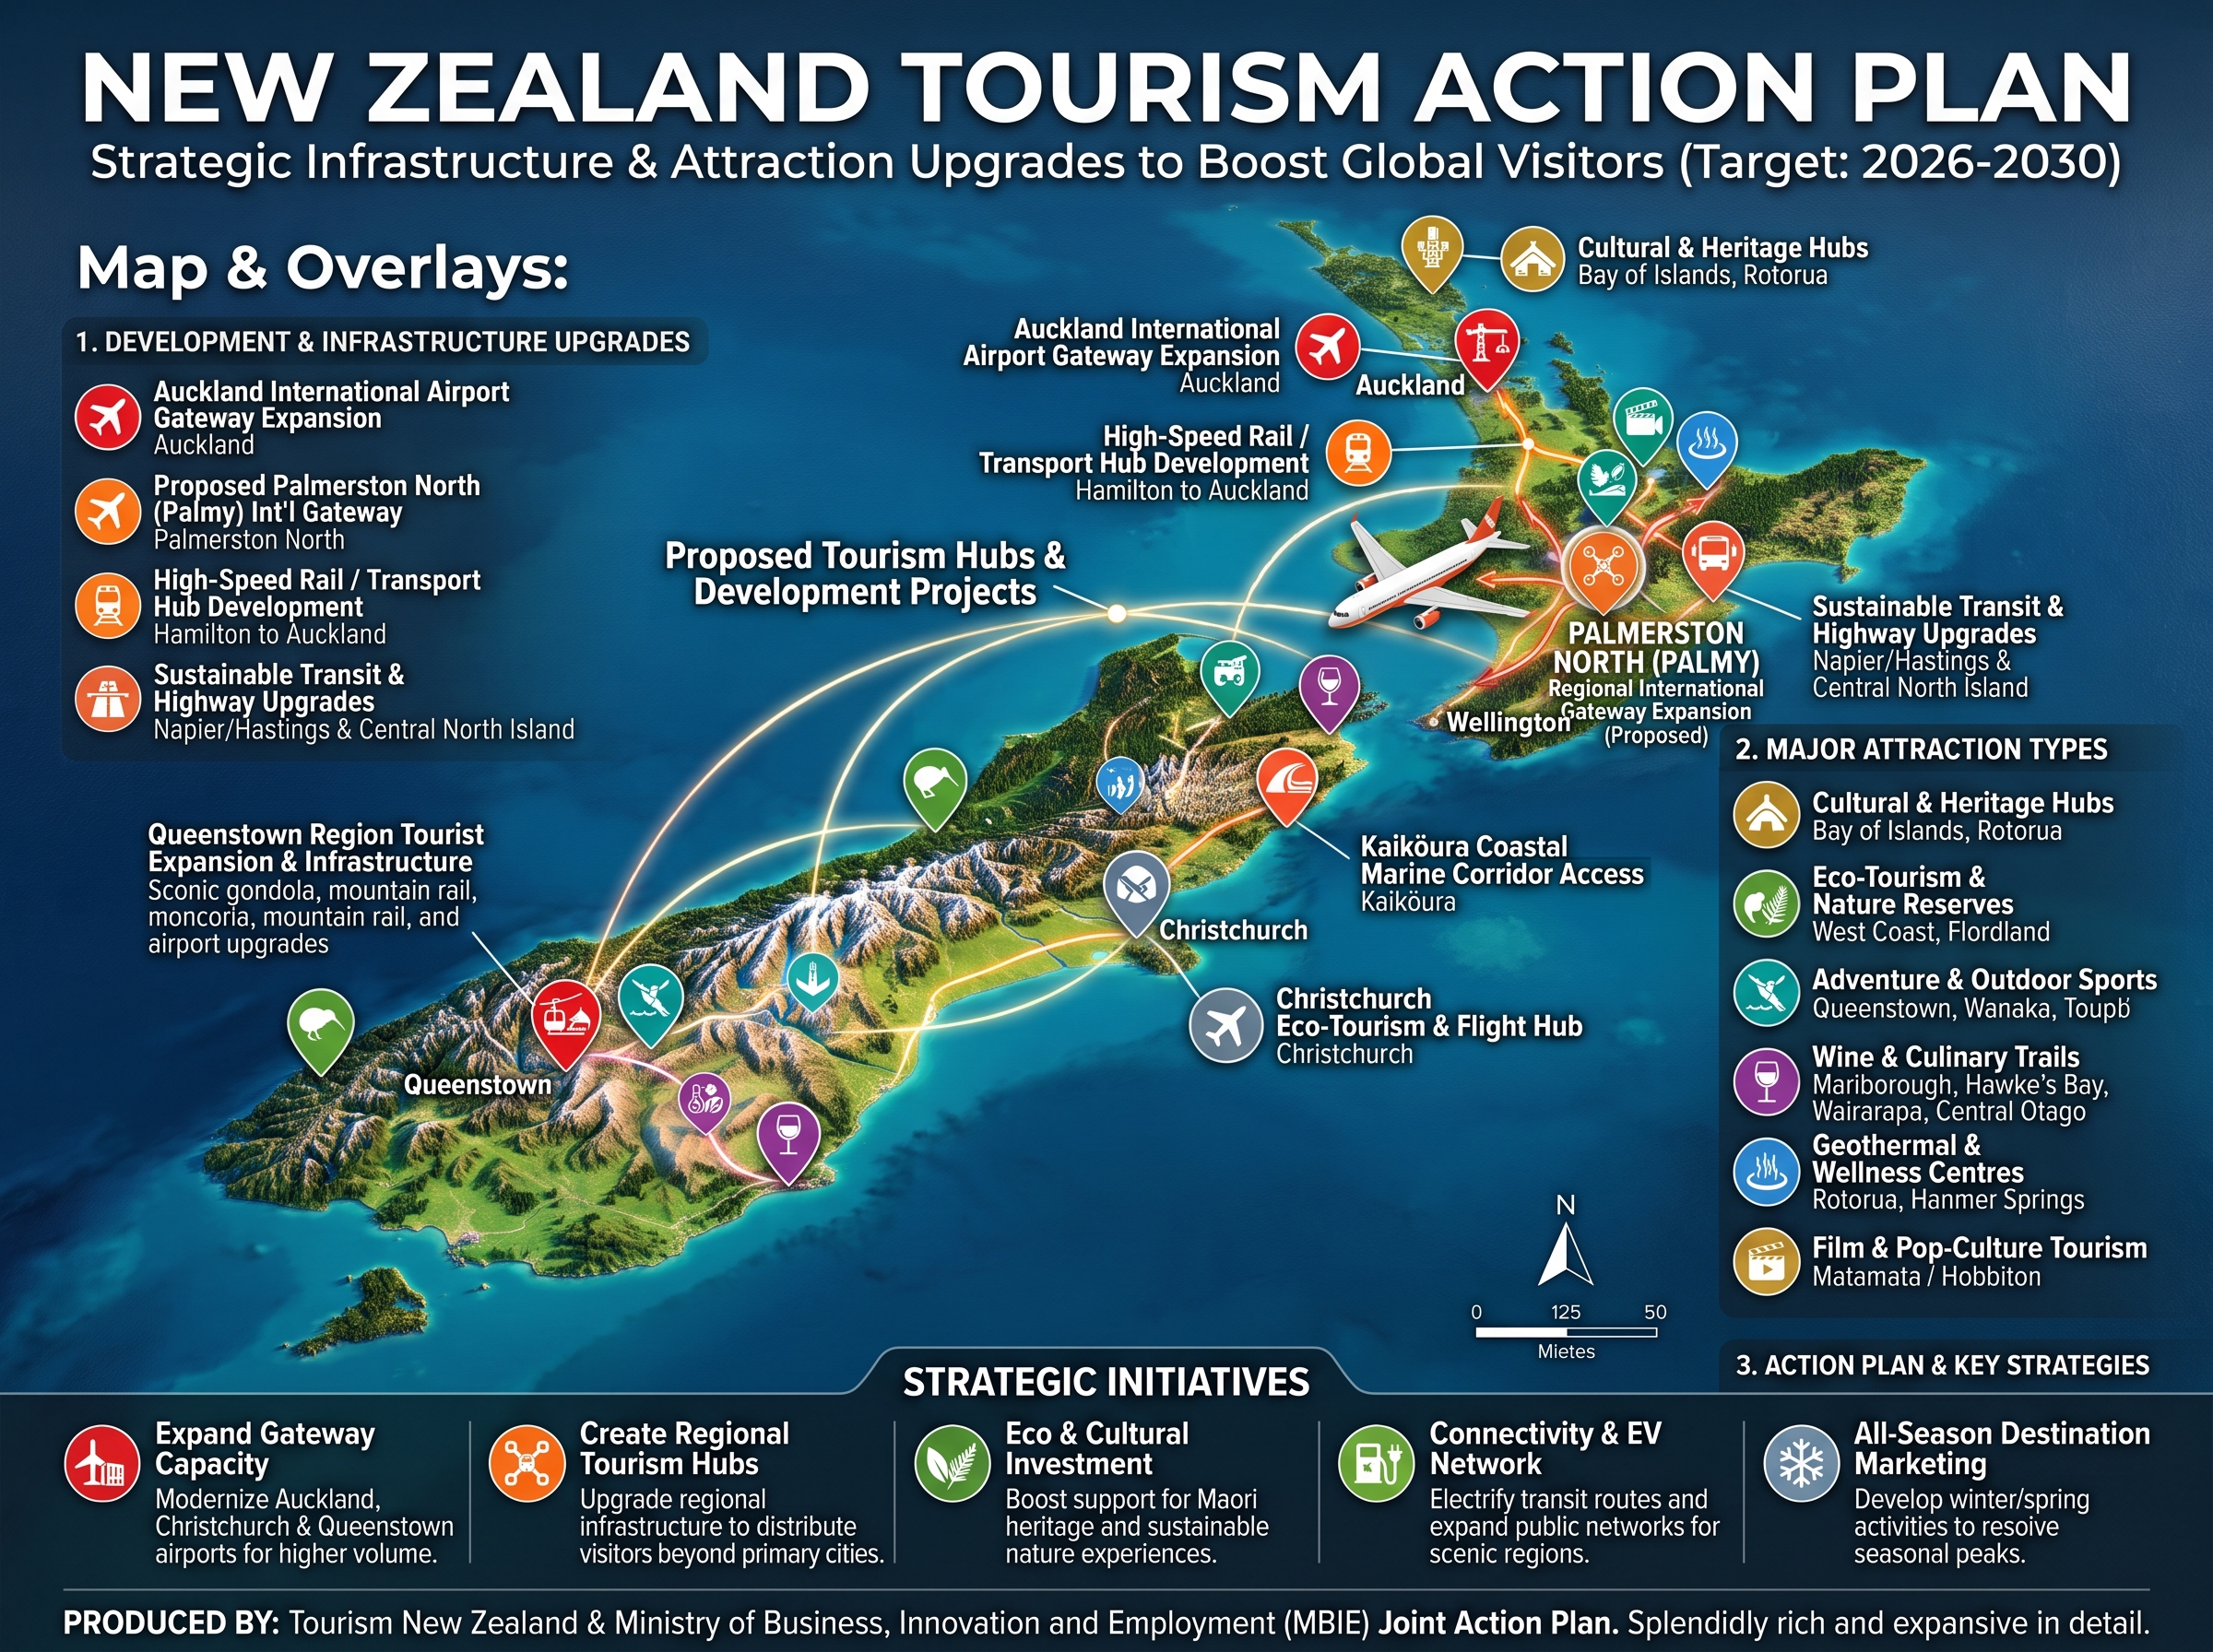
Explore the economic and public-spending charts that sparked this project. Each one is a starting point for better questions — not the final word.
These are illustrative charts supplied with the project. Figures, projections and source attributions should be checked against original data before being used to draw conclusions.
Policy comparisons & issue visuals
Policy choices and the issues we’re working through.
Explore policy mechanisms and issue visuals. Potential effects are questions to test against published commitments, independent evidence and observed outcomes—not predictions or endorsements.
Aotearoa New Zealand · policy choices
Policy mechanisms and outcomes
Policy effects depend on design, funding, implementation and wider conditions. Compare published commitments using consistent measures and evidence.
Potential effectsEvidence to examine
Metric 01 · Macroeconomic stability
Cost of Living Trajectory
Spending and tax settings
Fiscal choices
POSSIBLE CHANNELS
Changes to public spending, taxes and regulation can affect demand, incentives and the services households receive.
EVIDENCE TO EXAMINE
Prices and public finances: Test effects against independent inflation forecasts, fiscal costings and service-level data.
Distribution: Check who pays, who benefits and whether any costs shift to households.
Transfers and public services
Income support
POSSIBLE CHANNELS
Changes to transfers, wages or public services can affect household incomes, access to support and public expenditure.
EVIDENCE TO EXAMINE
Household outcomes: Measure effects by income, family type and service access.
Prices and funding: Check fiscal costs and inflation assumptions; neither outcome follows automatically.
Metric 02 · Housing & tenancy
Rental Market & Landlord Dynamics
Rental supply measures
Investor settings
POSSIBLE CHANNELS
Tax and tenancy rules may affect landlord costs, rental supply, investment and tenant security.
EVIDENCE TO EXAMINE
Rents and supply: Track rents, vacancy rates and new rental homes over time.
Distribution: Assess effects on tenants, landlords and public finances.
Tenant and public-housing measures
Housing security
POSSIBLE CHANNELS
Tenant protections and public housing investment may affect housing security, costs and the mix of available homes.
EVIDENCE TO EXAMINE
Access and security: Measure housing availability, tenancy stability and affordability.
Delivery and cost: Check build rates, implementation, funding and effects on private supply.
Metric 03 · Property markets
Cost of Homeownership & Affordability
Planning and construction measures
Housing supply
POSSIBLE CHANNELS
Land-use, infrastructure and consenting settings may affect where and how quickly homes can be built.
EVIDENCE TO EXAMINE
Capacity and completion: Compare consent numbers with completed homes and infrastructure capacity.
Affordability: Track prices and rents alongside supply, population and financing costs.
Tax and purchase-support measures
Homeownership
POSSIBLE CHANNELS
Tax settings and purchase assistance may affect buyer costs, investor demand, homeownership and government revenue.
EVIDENCE TO EXAMINE
Access: Measure first-home purchases, deposits and ownership rates.
Market response: Check effects on prices, rents, construction and public finances.
Metric 04 · Labour & economy
Employment & Enterprise Growth
Private-sector measures
Business and hiring
POSSIBLE CHANNELS
Employment rules, taxes, regulation and infrastructure partnerships may affect business costs and hiring decisions.
EVIDENCE TO EXAMINE
Jobs and investment: Track hiring, wages, productivity and business investment by industry.
Work conditions: Assess job security, training, safety and the distribution of gains.
Public investment and employment measures
Public services and transition
POSSIBLE CHANNELS
Public investment and employment standards may affect service capacity, workforce conditions and government expenditure.
EVIDENCE TO EXAMINE
Services and jobs: Measure access, staffing, pay and employment across sectors.
Funding and activity: Check costs, productivity, private-sector responses and delivery.
Metric 05 · Migration & talent
Brain Drain & Talent Retention
Earnings and tax settings
Take-home pay
POSSIBLE CHANNELS
Tax rates, wages and living costs may influence disposable income and decisions about where to work.
EVIDENCE TO EXAMINE
Retention: Track migration by occupation, age and income, alongside vacancies and wages.
Comparisons: Account for housing costs, services, family ties and conditions in destination countries.
Public services and living conditions
Quality of life
POSSIBLE CHANNELS
Access to services, infrastructure, environmental conditions and household costs may influence decisions to stay or move.
EVIDENCE TO EXAMINE
Retention: Compare migration and workforce data across occupations and regions.
Trade-offs: Assess service outcomes, tax costs and living standards together.